When Michelle Bullock spoke after the last RBA meeting, she said that the problem in the Australian economy was that demand was too high, and that’s the reason that rates needed to go up. But what demand are we talking about? Well, when we look at this, the issue is it’s really public sector demand. It’s how much the government is spending.
And what’s really interesting in the most recent releases by the International Monetary Fund is how much that spending has increased in the last year. We can see this by looking at the budget numbers for the deficit, or the public sector borrowing requirement, which is of course equal to the deficit, that were released in the most recent publications of the International Monetary Fund.
In April and October each year, the International Monetary Fund releases its estimates for future budget deficits for member countries, and the most recent were published on the 16th of October, only some days ago. The larger the budget deficits are, the bigger the amount that central banks have to raise interest rates to control inflation.
The IMF numbers for net borrowing required to finance the Australian budget deficit appear to have been revised upwards by around 1% of GDP in the most recent release by the IMF, from the deficit in 2026 and the amount of borrowing in 2026 all the way out to and including 2030. Compared to the previous estimate of a public sector borrowing requirement for Australia of 2.43% of GDP at the beginning of the year, that estimate has now increased to a deficit for 2026 of 3.2%, which is an increase of 0.8 of 1%.
Bigger deficits, of course, mean higher interest rates from the central bank to finance them. The IMF tell us that the Australian deficit estimate that must be financed for next year, 2027, rises from 2.05% to 2.98%, just under one full percentage point.
In 2028, we get to an increase of a full percentage point, when the deficit estimated for 2028 rises from 1.8% to 2.8%. The same sort of thing happens in the deficit for 2029. It rises from 1.66% to 2.61%, and the deficit for 2030 rises by just under 1%, from 1.48% to 2.4%.
These increasing budget deficits take Australian budget deficits very close to those of European welfare states. And the higher the budget deficit, the higher the RBA has to take rates to finance them.
But when we look at a chart of the history of the Australian budget balance, together with these future estimates, we come to perhaps a surprising understanding of how much budget deficit Australia actually needs to run an economy, or doesn’t need. We can see this in the chart for the Australian budget balance for the period from the beginning of this century, the year 2000, out to the end of the forecast period, which is 2030.
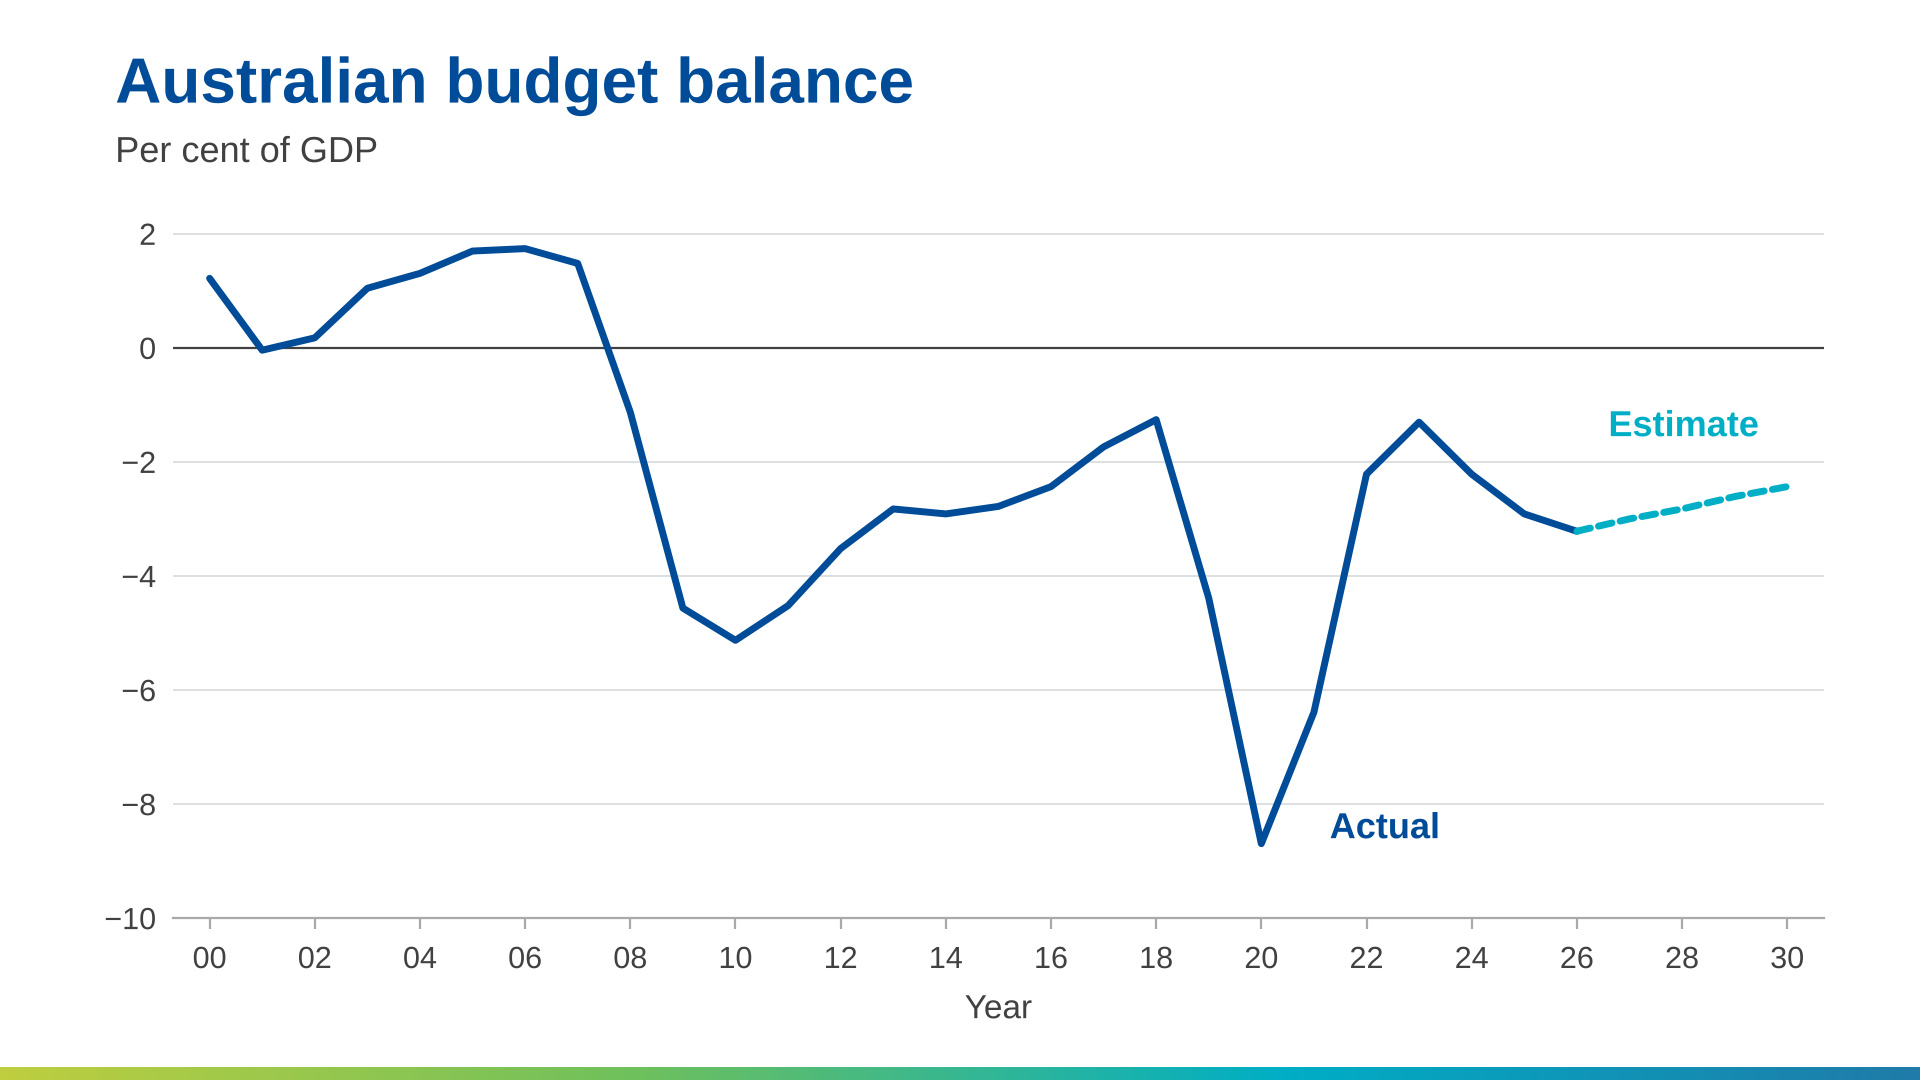
What’s particularly interesting is that for the first seven years of this century, we didn’t need a budget deficit at all. The Australian budget, under the Howard-Costello period, was actually in slight surplus, and it was only with the recession of 2008 that there was a swing to deficit, and a big swing to deficit.
This was when Kevin 07 came to power, and we moved from a surplus of 1.5% of GDP in the Australian federal budget to a deficit of 5.1% of GDP in 2010. That then recovered to a much smaller deficit of 1.3% of GDP in 2018, before plunging to a deficit of 8.7% of GDP in the pandemic year of 2020.
Our deficit then recovered to a deficit of only 1.3% in 2023, during the period at the end of the last Coalition government.
The coming of the Albanese government to power has seen a dramatic expansion of the Australian budget deficit.
As we’ve previously said, that means that there are higher levels of demand and a greater need for the RBA to push up interest rates.
We see this with the expansion of the budget deficit to 3.2% of GDP in this year that we’re in, 2026. The IMF believes that these deficits will continue all the way out to a deficit of 2.4% of GDP in 2030.
So the issue for Australia is that these continuing federal deficits generate upward pressure on demand, and they have put the RBA in a situation where, to balance that demand, it has to push up interest rates. So this is the problem of where high interest rates come from.
They come from balancing government demand. But we must see how that plays out over the coming years in Australia.
Want to discuss how this impacts your portfolio?
DISCLAIMER: Information is of a general nature only. Before making any financial decisions, you should consult with an experienced professional to obtain advice specific to your circumstances.