

Research notes
Stay informed with the most recent market and company research insights.

Research Notes
Back on track
FY25 Result
Cost-out complete, FUA growth in focus
A tale of two halves
Outlook softened but momentum should improve
Hoping fish oil prices will improve
Consistent Delivery
FY25 Earnings: Showing us the revenue ramp-up
Back to growth
Step change efficiency target for FY27
News & insights

Key Summaries
- Shares vs property investment Australia comparisons often rely on misleading house price data
- Property returns usually ignore decades of renovation, rebuild, and holding costs
- Share market returns already account for reinvestment and operating expenses
- Net rental income is far lower than most investors expect
- When compared fairly, shares have historically delivered stronger long-term returns
Why property appears as an attractive investment
Charts showing soaring Australian house prices regularly circulate in the media and on social platforms. At first glance, they make property appear unbeatable. The gains look massive, tangible, and reassuring. However, these comparisons have flaws.
Most property vs shares debates compare raw house prices with share market returns, without accounting for the hidden costs of owning property. When those costs are included, the investment story changes dramatically.
Why raw house price data can be misleading
Unlike shares, residential property physically depreciates over time. The Australian Taxation Office estimates that residential buildings have an effective lifespan of approximately 25 to 40 years1, during which significant capital expenditure is typically required to maintain functionality and value.
House price charts, however, reflect only the sale price of a property at a specific point in time. They do not account for renovation expenses, major repairs or rebuilds, ongoing maintenance, or the holding and transaction costs incurred throughout the ownership period2.
By contrast, share market returns are reported after companies have already absorbed the costs of reinvestment, staffing, equipment and business expansion5,6. This structural difference is a key reason why property investment performance is often overstated when compared to shares.
The ongoing costs of property ownership
Property investors face a range of ongoing expenses that share investors simply do not encounter. These holding costs include, but are not limited to, council rates, insurance, maintenance and repairs, body corporate fees, land tax and periods of vacancy when no rental income is received.
According to estimates from the Reserve Bank of Australia (RBA), basic holding costs for residential property average around 2.6% per year2, even before accounting for financing costs. When this is compared to current gross rental yields of approximately 3%3, the result is often a near-zero net yield once expenses are deducted.
In practice, this means that a large portion of rental income, even for properties that appear cash-flow positive on paper, is frequently absorbed by ongoing maintenance and ownership costs rather than generating meaningful surplus income.
In the current property market environment, many investors also rely on negative gearing, where rental income is insufficient to cover loan repayments and expenses. As a result, investors must regularly contribute additional personal funds to service the shortfall, placing further pressure on cash flow. Not to forget, the significant transaction costs of these investments, such as stamp duty, solicitor fees, building and pest reports and buyer’s agent fees.
Adding to this, investment properties are commonly financed using interest-only loans, particularly in the early years. While this may reduce short-term repayments, it means no principal is being repaid during the interest-only period. This increases the investor’s long-term capital requirements and leaves returns heavily dependent on future capital growth rather than income.
How shares work differently to property
Shares function very differently from property investments. Long-term performance figures for major share market indices such as the ASX 300, S&P 500, and Nasdaq already reflect the ongoing reinvestment required to keep businesses operating and growing 5,6. Costs associated with replacing assets, upgrading technology, paying staff, and expanding operations are absorbed at the company level and are accounted for before returns reach investors.
For income-producing shares, dividends are distributed only after all business expenses have been covered. In Australia, franking credits can further enhance after-tax returns8, and investors have the flexibility to reinvest this income or use it to support living expenses in retirement. This structure makes shares significantly more efficient from a cash flow perspective.
When assessed on a like-for-like basis, shares have historically produced higher net returns than property, while requiring less hands-on management and offering greater diversification, which helps reduce overall investment risk7.
Why this matters for Australian Investors
Australians have gained significant wealth through property ownership, particularly in recent years during periods of strong price growth4. However, strong historical performance does not automatically mean property will continue to be the superior investment in all market conditions.
A clear understanding of the true cost structure of property investing allows investors to set more realistic return expectations, create more balanced and diversified portfolios, and make more informed financial planning decisions throughout their working years and into retirement.
Final thoughts
Property is not a passive, set-and-forget investment. Over time, it depreciates, requires ongoing capital expenditure, and demands regular maintenance. Shares, by contrast, incorporate reinvestment within their returns and provide income to investors after business costs have been met5,6.
When assessed on a like-for-like basis, shares have historically delivered stronger long-term performance than property, while requiring less effort, involving lower ongoing costs, and offering greater access to diversification.
If you would like to discuss your investmemt options, please contact a Morgans Financial Adviser. Please note, A Morgans Adviser cannot provide advice on an Investment property.
Frequently Asked Questions
Is property still a good investment in Australia? Yes, but it should not be viewed in isolation. Property can play a role, but the narrative that it outperforms shares is not necessarily the case. The total net costs of both investments need to be included.
Why do house price charts look so impressive? They ignore renovation, rebuild, and maintenance costs, making growth appear higher than reality 1,2.
Are shares riskier than property? Shares fluctuate more short-term, but property carries concentration, liquidity, and capital risk that is often underestimated7.
What is the biggest hidden cost in property investing? Capital reinvestment over time, including major renovations and rebuilds, which are rarely factored into returns 1,2.
Which performs better long term: shares vs property investment Australia? Historically, diversified shares have delivered higher net returns with lower ongoing costs 5,6,7.
References
1. Australian Taxation Office (ATO) – Capital works deductions and effective life of buildings https://www.ato.gov.au/Individuals/Investing/Investing-in-property/
2. Reserve Bank of Australia (RBA) – Housing and Housing Finance Statistics ttps://www.rba.gov.au/statistics/housing.html
3. CoreLogic – Australian Housing Market & Rental Yield Data https://www.corelogic.com.au
4. Australian Bureau of Statistics (ABS) – Residential Property Price Indexes https://www.abs.gov.au/statistics/economy/price-indexes-and-inflation/residential-property-price-indexes-eight-capital-cities
5. ASX – Long-term Investment Returns and Dividends https://www.asx.com.au/investors/investment-tools-and-resources/education/shares
6. Vanguard – Index Chart® and Long-Term Market Returns https://www.vanguard.com.au/personal/learn
7. Australian Securities & Investments Commission (ASIC) – Shares, Property and Diversification https://asic.gov.au/investors/
8. ATO – Dividend Income and Franking Credits https://www.ato.gov.au/Individuals/Investing/Investing-in-shares/

Australia’s households could face higher electricity costs and rising inflation in 2025. With electricity subsidies ending and energy supply constraints persisting, the Reserve Bank of Australia (RBA) may be forced to lift interest rates. Here’s what you need to know.
Key Summaries
- Retail electricity subsidies worth $9 billion per year are being phased out.
- Retail electricity prices are expected to rise sharply in 2025.
- Inflation could accelerate to 4% or more in the second half of the year.
- RBA may then need to make three 25-basis-point rate hikes.
- The cost of renewable energy is not just the cost of wind and solar,
natural gas is also needed to stabilise renewable energy.
Why Are Electricity Prices Rising?
The government’s decision to remove $9 billion in electricity subsidies will expose households to the true cost of power. Over the past two years, wholesale electricity generation costs have surged by 23%, driven by supply constraints and reduced capacity in New South Wales.
How Will This Impact Inflation?
Electricity prices feed directly into the Consumer Price Index (CPI) with a lag of around two quarters. As subsidies end, retail prices will rise, pushing inflation higher, especially in the second half of 2025. Businesses will face increased costs and pass these on to consumers.
Interest Rates: RBA’s Likely Response
Higher inflation means the RBA will need to act. While some banks forecast small rate hikes early in the year, Morgans expects three 25-basis-point increases in the second half of 2025. This could significantly impact mortgage holders and borrowing costs.
The Role of Renewable Energy and Gas Pricing
Despite claims that renewables are the cheapest energy source, electricity prices remain high because consumers need power 100% of the time. The marginal cost of electricity is set by natural gas, which stabilises supply when renewables cannot meet demand. Global gas prices, influenced by events such as the war in Ukraine, ultimately determine the cost of electricity in Australia.
FAQs
Why are electricity prices increasing in Australia?
Because subsidies are ending and generation costs have risen by 23% over the last two years.
How will this affect inflation?
Consumer prices could rise by 4% in the second half of 2025 as higher energy costs flow through the economy.
Will interest rates go up?
Yes, the RBA may raise rates three times in the second half of 2025 to curb inflation.
Are renewables making electricity cheaper?
Not necessarily. Prices are influenced by natural gas, which sets the marginal cost of supply.
What does this mean for households?
Expect higher power bills and increased mortgage costs if rates rise.
Australia faces a challenging year ahead with rising electricity costs, accelerating inflation, and likely interest rate hikes. Planning ahead is essential for households and investors.
Want to discuss how this impacts your portfolio?
DISCLAIMER: Information is of a general nature only. Before making any financial decisions, you should consult with an experienced professional to obtain advice specific to your circumstances.

Federal Reserve Interest Rate Outlook: What Investors Need to Know
The Federal Reserve’s latest projections reveal a surprisingly moderate outlook for inflation and interest rates. Despite tariff concerns earlier this year, the Fed expects inflation to remain subdued and rates to decline gradually. Here’s what this means for markets and investors.
Key Takeaways
- Fed forecasts interest rates around 3.4%, aligning with market expectations.
- Inflation impact from tariffs is far lower than predicted.
- Core inflation expected to fall to 2.5% next year and reach target levels by 2028.
- Growth outlook remains positive with no recession in sight.
- A benign economic environment could support U.S. equities.
What the Fed’s Latest Projections Tell Us
Every quarter, the Federal Reserve releases its Summary of Economic Projections (SEP), which includes forecasts from the Federal Open Market Committee and regional Fed banks. These projections carry significant weight because they reflect the collective view of some of the most influential economists in the U.S.
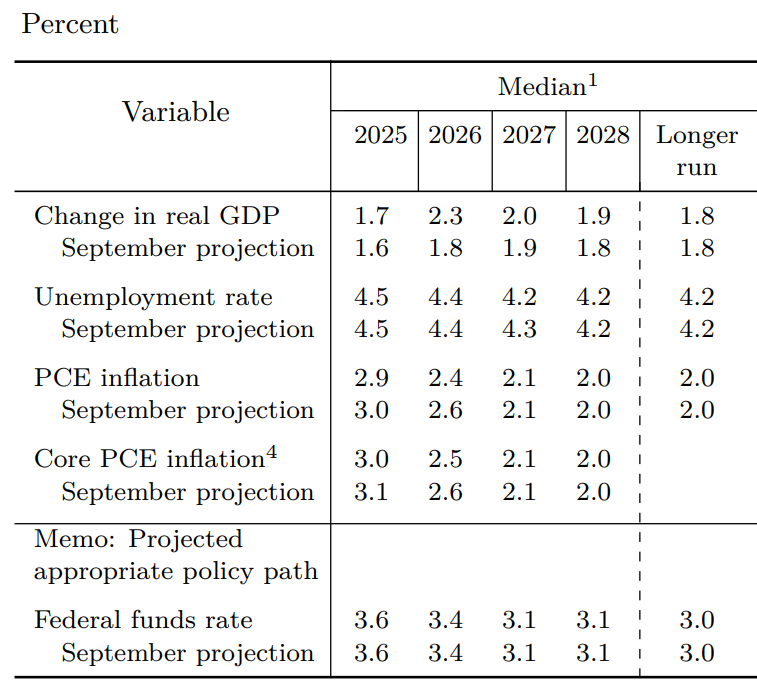
Table 1. Economic projections of Federal Reserve Board members and Federal Reserve Bank presidents, under their individual assumptions of projected appropriate monetary policy, December 2025
Interest Rate Outlook: Gradual Declines Ahead
Our model estimated the equilibrium Fed funds rate at 3.35%, and the Fed’s own forecast is close at 3.4%. This suggests rate cuts are likely in the near term, with further declines to 3.1% in subsequent years. For investors, this signals a stable environment for borrowing and equity markets.
Inflation: Lower Than Expected Despite Tariffs
Earlier predictions suggested tariffs could push inflation up by 1.6%, but the actual impact has been minimal. Headline inflation is projected at 2.9%, and core inflation at 3%, well below initial fears. The Fed expects core inflation to fall to 2.5% next year, then to 2% over the longer term.
Growth Outlook: No Recession on the Horizon
Despite global uncertainties, the Fed anticipates steady growth: 1.7% this year, 2.3% next year, and 2% thereafter. This benign outlook, combined with easing inflation, suggests a supportive environment for U.S. equities.
FAQs
Q1: Why is the Fed cutting rates?
To maintain economic stability and support growth amid moderating inflation.
Q2: How will lower rates affect investors?
Lower rates typically reduce borrowing costs and can boost equity markets.
Q3: Are tariffs still a risk for inflation?
Current data shows tariffs had a smaller impact than expected, thanks to strong service-sector productivity.
Q4: Is a U.S. recession likely?
The Fed’s projections show no signs of recession in the near term.
Q5: What is the Fed’s inflation target?
The Fed aims for 2% core inflation, which it expects to achieve within a few years.
The Federal Reserve’s outlook points to a stable economic environment with easing inflation and gradual rate cuts. For investors, this could mean continued opportunities in equities and fixed income. Want to learn more about how these trends affect your portfolio?


