Research notes
Stay informed with the most recent market and company research insights.

Research Notes
Recalibrating for recurrence
Model update, lowering our D&A
A solid platform for further growth into FY26
FY25 earnings: Don’t Look Back in Anger
Green spend threatens to dilute green returns
Dividend and Outlook are ahead of our expectations
The calm before the storm
Through the worst of it
Watching brief
The road to recovery more than a 2H25 turnaround
News & insights
In recent days, several people have asked for my updated view on the Federal Reserve and the Fed funds rate, as well as the outlook for the Australian cash rate. I thought I’d walk through our model for the Fed funds rate and explain our approach to the RBA’s cash rate.
It’s fascinating to look at the history of the current tightening cycle. The Fed began from a much higher base than the RBA, and in this cycle, they reached a peak rate of 535 basis points, compared to the RBA’s peak of 435 basis points. For context, in the previous tightening cycle, the RBA reached a peak of 485 basis points.
The reason the RBA was more cautious this time around is largely due to an agreement between Treasurer Jim Chalmers and the RBA. The goal was to implement rate increases that would not undo the employment gains made in the previous cycle. As a result, the RBA was far less aggressive in its approach to rate hikes.
This divergence in peak rates is important. Because the Australian cash rate peaked lower, the total room for rate cuts and the resulting stimulus to the economy is significantly smaller than in previous cycles.
The Fed, on the other hand, peaked at 535 basis points in August last year and began cutting rates shortly after. By the end of December, they had reduced the rate to 435 basis points, where it has remained since.
Recent U.S. labour market data shows a clear slowdown. Over the past 20 years, average annual employment growth in the U.S. has been around 1.6 percent, but this fell to 1.0 percent a few months ago and dropped further to 0.9 percent in the most recent data.
This suggests that while the Fed has successfully engineered a soft landing by slowing the economy, it now risks tipping into a hard landing if rates remain unchanged.
Fed Funds Rate Model Update
Our model for the Fed funds rate is based on three key variables: inflation, unemployment, and inflation expectations. While inflation has remained relatively stable, inflation expectations have declined significantly, alongside the drop in employment growth.
As a result, our updated model now estimates the Fed funds rate should be around 338 basis points, which is 92 basis points lower than the current rate of 435. This strongly suggests we are likely to see a 25 basis point cut at the Fed’s September 17 meeting.
There are two more Fed meetings scheduled for the remainder of the year, one in October and another on December 10. However, we will need to review the minutes from the September meeting before forming a view on whether further cuts are likely.
Australian Cash Rate Outlook
Turning to the Australian cash rate, as mentioned, the peak this cycle was lower than in the past, meaning the stimulatory effect of rate cuts is more limited.
We have already seen three rate cuts, and the key question now is whether there will be another at the RBA’s 4 November meeting.
This decision hinges entirely on the September quarter inflation data, which will be released on 29 October 2025.
The RBA’s strategy is guided by the concept of the real interest rate. Over the past 20 years, the average real rate has been around 0.85 percent. Assuming the RBA reaches its 2.5 percent inflation target, this implies a terminal cash rate of around 335 basis points. Once that level is reached, we expect it will mark the final rate cut of this cycle, unless inflation falls significantly further.
So, will we see a rate cut in November?
It all depends on the trimmed mean inflation figure for the September quarter. If it comes in at 2.5 percent or lower, we expect a rate cut. The June quarter trimmed mean was 2.7 percent, and the monthly July figure was 2.8 percent. If the September figure remains the same or rises, there will be no cut. Only a drop to 2.5 percent or below will trigger another move.
We will have a much clearer picture just a few days before Melbourne Cup Day.

The Wall Street Journal of 21 August 2025 carried an article which noted that Ether, a cryptocurrency long overshadowed by Bitcoin has surged in price in August.
The article noted that unlike Bitcoin, there was not a hard cap on Ether supply, but the digital token is increasingly used for transactions on Ethereum , a platform where developers build and operate applications that can be used to trade, lend and borrow digital currencies.
This is important because of the passage on 18 July 2025 of the GENIUS act which creates the first regulatory framework for Stablecoins. Stablecoins are US Dollar pegged digital tokens. The Act requires that Stablecoins , are to be to be fully backed by US Treasury Instruments or other US dollar assets .
The idea is that if Ethereum becomes part of the infrastructure of Stablecoins , Ether would then benefit from increased activity on the Ethereum platform.
Tokenized money market funds from Blackrock and other institutions already operate on the Ethereum network.
The Wall Street journal article goes on to note that activity on the Ethereum platform has already amounted to more than $US1.2 trillion this year ,compared with $960 million to the same period last year.
So today ,we thought it might be a good idea to try and work out what makes Bitcoin and Ether go up and down.
As Nobel Prize winning economist Paul Krugman once said " Economists don't care if a Model works in practice ,as long as it works in theory" . Our theoretical model might be thought as a "Margin Lending Model" . In such a model variations in Bitcoin are a function of variation in the value of the US stock market .
As the US stock market rises, then the amount of cash at margin available to buy Bitcoin also rises .
The reverse occurs when the US stock market goes down .
Our model of Bitcoin based on this theory is shown in Figure 1 . We are surprised that this simple model explains 88% of monthly variation in Bitcoin since the beginning of 2019.
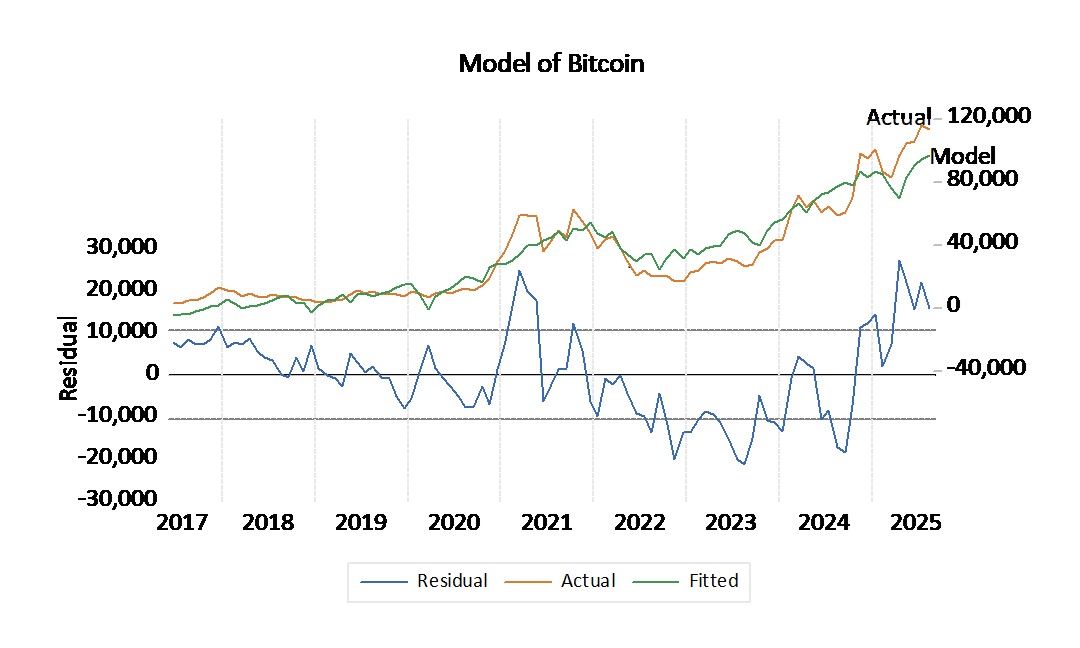
At the end of August our model told us that when Bitcoin was then valued at $US112,491 , that it was then overvalued by $US15,785 per token.
Modeling Ether is not so simple . Ether is a token but Ethereum is a business. this makes the price of Either sensitive to variations in conditions in the US Corporate Debt Market.
Taking that into account as well as stock market strength, gives us a model for Ether which is shown in figure 2.
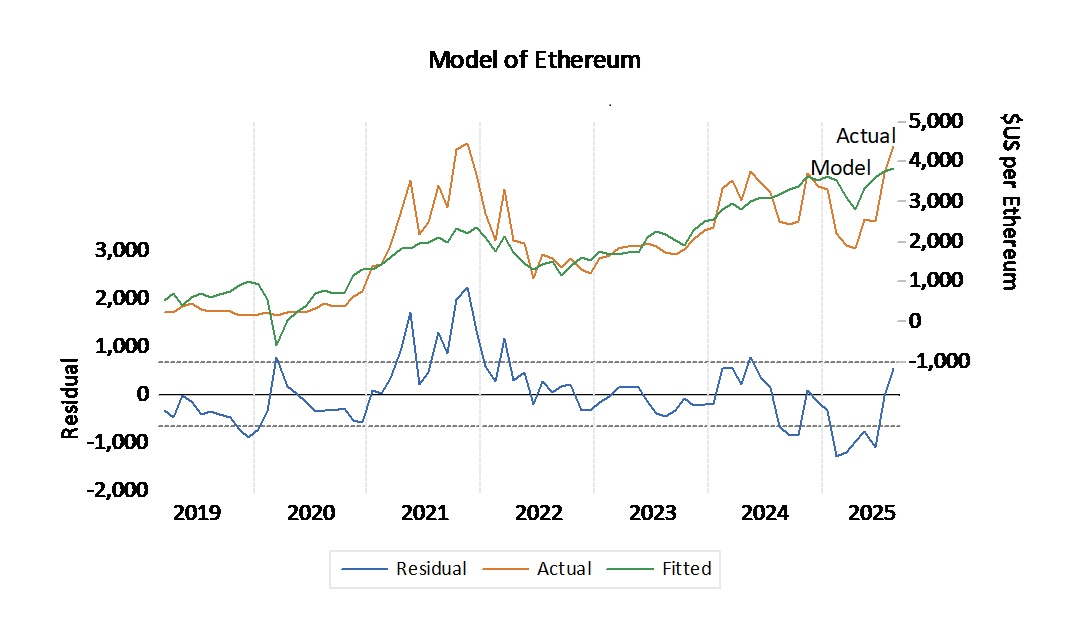
This model explains 70.1% of monthly variation since the beginning of 2019. Our model tells us that at the end of August, Ether at $US 4,378per token was $US 560 above our model estimate of $US3,818.00 . Ether is moderately overvalued.
So neither Bitcoin nor Ether are cheap right now.
ETFs for each of Bitcoin and Ether are now available from your friendly local stockbroker .
But right now , our models tell us that neither of them is cheap!
There is more to what happened at Jackson Hole than just the speech by Jay Powell.
In my talk last week ,I said that our model of the Fed funds rate stood at 3.65%. This is actually 70 basis points lower than the actual level of 4.35%.
I also said that the Fed was successfully achieving a "soft landing" with employment growing at 1%. This was below the median level of employment growth since 2004 of 1.6%.
Still , as I listened to Jay Powell Speak , I noted a sense of concern in his voice when he said that "The July employment report released earlier this month slowed to an average pace of only 35,000 average per month over the past three months, down from 168,000 per month during 2024. This slowdown is much larger than assessed just a month ago."
My interpretation of this is that Chair Powell may be concerned that the "soft landing " achieved by the Fed may be in danger of turning into a "hard landing". This suggested a rate cut of 25 basis points by the Fed at the next meeting on 17-18 September.
This would leave the Fed Funds rate at 4.1%. This would mean that the Fed Funds rate would still be 45 basis points higher than our model estimate of 3.65%. Hence the Fed Funds rate would remain "modestly restrictive."
Dire Demography?
Jackson Hole was actually a Fed Strategy meeting with many speakers in addition to Jay Powell.
Two speakers who followed on the afternoon of his speech were Claudia Goldin, Professor at Harvard
and Chad Janis of Stanford Graduate Business School. They each gave foreboding presentations on the demography of developed economies.
Claudia Goldin spoke on "The Downside of Fertility". She noted that birth rates in the Developed World are now generally below replacement level. The Total Fertility rate is below 2 in France , the US and the UK.
It is dangerously low below 1.5 in Italy and Spain and below 1 in Korea. She observes that the age of first marriage of couples in the US is now 7 years later than it was in the 1960's. This reduces their child bearing years.
This paper was then followed by a discussion of it by Chad Janis of Stanford Graduate Business School. He noted that there is a profound difference between a future with a replacement rate of 2.2 kids per family , which he called the "Expanding Cosmos" with
• Growing population leading to a growing number of researchers, leading to rising living standards and Exponential growth in both living standards and population AND a replacement level of 1.9 kids per family which leads to
• Negative population growth , which he called "an Empty Planet " and the end of humanity
as numbers of researchers declines and economic growth ceases.
Of course this seems all very serious indeed . Perhaps what this really means ,is that if we want to save the world , we should just relax and start having a lot more fun!!