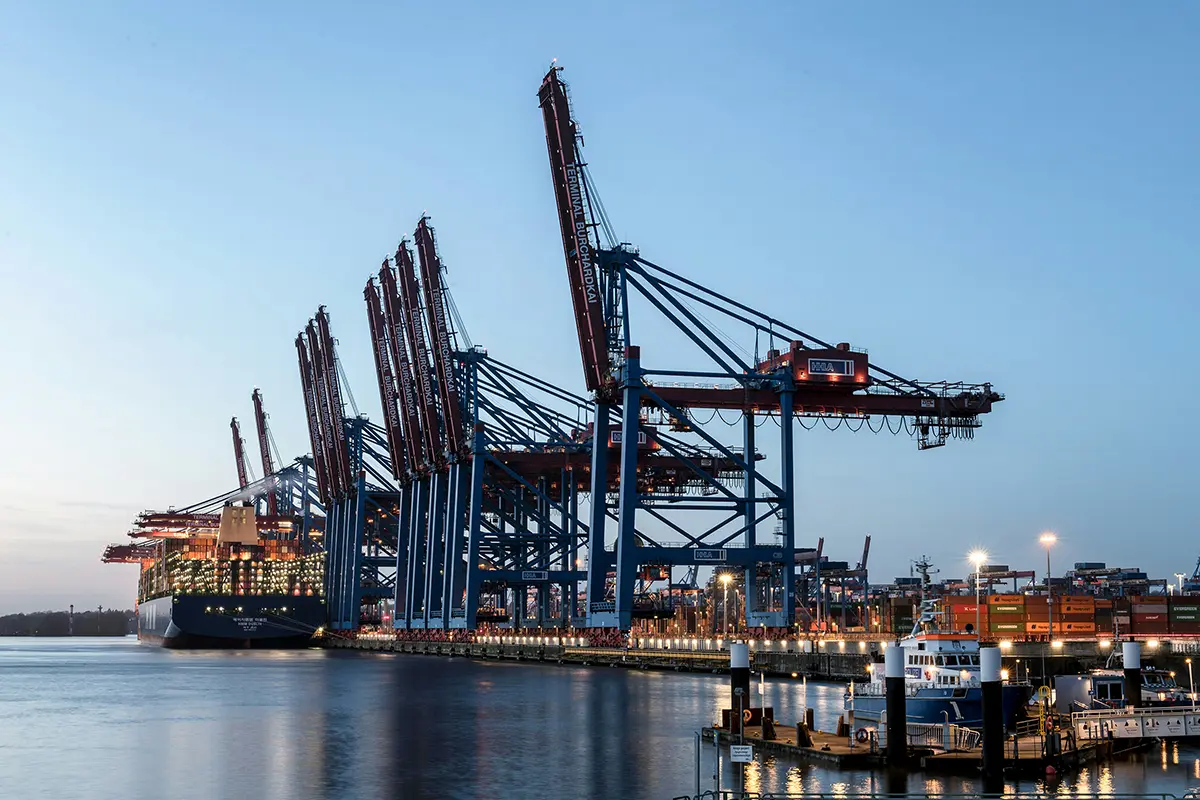
We recommend investors start making sense of AI by considering stock opportunities in three distinct areas: artificial intelligence, digital infrastructure, and data networks.

Jensen Huang, the rockstar CEO of NVIDIA, recently described Artificial Intelligence (AI) as ‘the most transformative technology of the 21st Century’ which ‘will affect every industry and aspect of our lives’. The CEO of Alphabet, Sundar Pichai, went further, saying AI is ‘probably the most important thing humanity has ever worked on’. Amid all this hyperbole, it can be daunting to know where to start as an investor looking to get exposure to AI. We offer one framework for thinking about this in the Month Ahead for November. We recommend investors start making sense of AI by considering stock opportunities in these three distinct areas:

Artificial Intelligence Providers

It is no coincidence that the world’s leading Cloud Service Providers (Microsoft, Amazon, and Google) are leading the race to commercialise Artificial Intelligence and Large Language Models (LLMs), alongside that technological shapeshifter Meta Platforms. These companies are also known as ‘Hyperscalers’ due to their technical expertise in operating computing infrastructure at levels of complexity that would make your head spin.

The Hyperscalers are typically well funded and cash generative. Their ‘ownership’ of business and personal data puts them at the forefront of building, training, and ultimately monetising LLMs. Collectively, these companies are expected to spend a staggering US$700bn in capex over the next three years, the bulk of which relates to AI.

In many ways, Microsoft (NASDAQ: MSFT) is the most uniquely positioned. As the key supplier of business productivity tools in the world, it has the vast technical expertise, data and customer base best suited to benefit from the rise of AI. As more and more businesses embrace AI we expect they will embrace Microsoft’s AI offering and both parties should benefit. Microsoft reported its September quarterly result on Wednesday and indicated Microsoft AI is on track to be its fastest ever product to reach $10bn in annual recurring revenue (less than three years).

      
MSFT coverage report
      

Digital Infrastructure

Digital infrastructure companies power the data centres, cloud computing and research activities that are integral to the digital ecosystem and the rise of AI. Internationally the best-known name in the space is AI chip supplier NVIDIA, which is widely held to be best in class and a unique value proposition.

Enjoying all the benefits of the AI growth opportunity with less volatility are the operators of data centres. Data centres are facilities that store, process, and manage the vast amounts of data foundational to AI, ensuring secure and efficient data flow, backup, and recovery. The largest operators in the world are Digital Realty and Equinix. Digital Realty recently reported a record sales quarter during which it sold double the data centre capacity of its previous high and about four times more capacity than it usually sells in a quarter. This reinforces our view that the significant demand for cloud computing and AI-related digital infrastructure is going to unpin attractive returns and long-term growth.

Here in Australia, the data centre space gathered recent attention following the recent $23bn purchase of private data centre operator AirTrunk. In the listed arena, NEXTDC and Goodman Group are the largest data centre operators on the ASX. Our preferred exposure is NEXTDC (ASX: NXT). It has 17 operational data centres in Australia and nearly a dozen under construction or about to be built across Australasia and Asia.

      
NXT coverage report
      

Data Networks

AI needs a combination of technical expertise, computing power, data centre space and data. An extremely large amount of data is needed to train an AI agent or LLM. Once the training is complete the AI agent also needs to be given regular up-to-date data in order to remain relevant and useful. This is where traditional data networks (such as telcos like Telstra, TPG Telecom, Superloop and Megaport) come into play.

Traditional telecommunications companies will benefit from the astronomical growth of data around AI. Telstra for instance is building a specialist inter-capital network with a A$1.5bn capital budget to fund this project. However, our preferred exposure is through the more specialised and capital-light Megaport (ASX: MP1). Megaport is a global cloud connection network and the leading Network as a Service provider. It operates the largest data centre connection business in the world, connecting to 850 data centres through a fully automated, on-demand telco network. We think it is uniquely placed to help business move data globally and benefit from the growth of data related to both cloud computing and AI.

      
MP1 coverage report
      

Morgans clients receive exclusive insights such as access to the latest stock and sector coverage featured in the Month Ahead. Contact us today to begin your journey with Morgans.

      
Contact Us
      
Find out more
Thank you! Your submission has been received!
Oops! Something went wrong while submitting the form.
J. Powell has stated that while the current level of US government debt is sustainable, the trajectory of that debt is not. This comment has sparked a discussion on how the Trump presidency, with its emphasis on cutting corporate taxes, will impact the US budget deficit.

Last week, during a press conference following the Federal Reserve's decision to cut rates by 25 basis points, something we had forecast, J. Powell was asked about the US government debt. He stated that while the current level of US government debt is sustainable, the trajectory of that debt is not. This comment has sparked a discussion on how the Trump presidency, with its emphasis on cutting corporate taxes, will impact the US budget deficit.

Looking ahead, the US budget deficit for 2026 will be drafted in 2025 when both the presidency and Congress — the Senate and the House of Representatives — are all under Republican control. Interestingly, the Speaker of the House, Mike Johnson, who is part of the conservative Freedom Caucus, has made it clear that he wants to reduce the size of the US budget deficit. This will be a key issue moving forward.

The US budget deficit has been a frequent topic of conversation because it can serve as an indicator of trends in the commodity cycle. For instance, the most recent low in the deficit occurred in 2022, at 3.9% of GDP, signalling the bottom of the cycle for commodities. However, the budget deficit rose to 7.6% of GDP in 2023, and for the current year, it is expected to peak at 7.63% of GDP. This suggests that the peak in commodity prices may occur around 2026.

A significant part of the discussion centres on President Trump's promise to reduce US corporate tax rates to 15%. This is the same corporate tax rate as Germany. The potential cost of this tax cut is substantial, with estimates ranging from $460 billion to $673 billion. For the sake of discussion, if we assume the cost is around $500 billion, the impact on the US budget deficit will be significant. Currently, the US deficit is estimated to be $2.2 trillion, or 7.3% of GDP, and projections for next year remain the same.

Sustainability in terms of the US budget deficit is generally considered to be a level that matches GDP growth. Given that US GDP growth is expected to be around 2%, the deficit could realistically be about $600 billion, much lower than the current $2.2 trillion. This creates a significant challenge for policymakers, especially since cutting spending will likely be the key to reducing the deficit.

Mike Johnson, as part of the Freedom Caucus, will push for cuts in government spending, and President Trump has appointed Elon Musk to assist in finding opportunities to streamline government expenses. Musk, who is known for his ability to cut costs in companies like Tesla and X (formerly Twitter), will look for inefficiencies in government spending, even though the "Department of Government Efficiency" he is heading will exist only as an advisory body. Nevertheless, Musk’s skill and reputation for cost-cutting could play a crucial role in helping to bring down the deficit.

The push to reduce the budget deficit while implementing tax cuts will be a central focus in the lead-up to the 2026 US budget. The proposed corporate tax cuts to 15% will add roughly $500 billion to the deficit, but they are expected to increase after-tax corporate earnings, which should drive stock prices higher. This contrasts with the Democrats' proposal to increase corporate taxes, which would likely lead to a sell-off in the stock market and a potential recession in the following year.

If the Republican-led government can successfully reduce the budget deficit while implementing corporate tax cuts, it could be a significant boost to both the US economy and the stock market in 2026.

Find out more
No items found.
November 8, 2024
8
November
2024
2024-11-08
min read
Nov 08, 2024
How Low Can the Fed Go?
Michael Knox
Michael Knox
Chief Economist and Director of Strategy
The easiest way to understand what central banks are doing is to look at employment growth. Let's look at what’s been happening this week and why the Reserve Bank of Australia held rates where they were.

Well, I’ve spoken before about the Reserve Bank of Australia and the Federal Reserve. The easiest way to understand what central banks are doing is to look at employment growth. When employment growth is higher than the long-term median, central banks tend to either hold rates where they are or to tighten. When employment growth is lower than the long-term median, central banks tend to cut rates.

So, today we’ll look at where things are and explain what’s been happening this week and why the Reserve Bank of Australia held rates where they were, and why the Fed cut rates by 25 basis points. In the first slide, what you see is the rate of growth of employment in Australia. The long-term median is 2.3%, but the current rate of employment growth is 2.97%. So, it’s above the long-term median, and that’s strong. This is largely due to support from the federal government employing people in the public sector. But as the Deputy Governor of the Reserve Bank says, these are still real jobs. For that reason, the RBA is holding rates steady until inflation falls or unemployment rises. This means that if unemployment rises, we can expect inflation to fall in the future.

The Federal Reserve, on the other hand, has a different story. When we look at the rate of growth of employment in the US, the level of actual employment year-on-year is 1.3%. Employment growth has been slowing as we go through the year, and that’s lower than the long-term median of 1.6%. At the previous meeting, the Fed cut by 50 basis points. I had forecast at that time that it would continue cutting rates in November and December, and we just saw a 25 basis point cut today. At the Fed Reserve press conference after the Fed statement was released, Jay Powell said that geopolitical risks to the US economy are elevated. Still, he said that when we look at the US economy, it is still very sound, with strong growth, a strong labour market, and inflation coming down.

When he was asked about the US national debt, Powell said the national debt is not unsustainable, but the path of the growth of that debt is. In other words, the size of the US deficit is too large.   If the growth in US Debt continues, Powell warned, it will ultimately be a threat to the economy.

Since the election of Donald Trump, we’ve seen that there is a significant number of supporters in the House of Representatives of proposals to cut spending. Also, suggestions for cuts could come from figures like Elon Musk, while Robert F. Kennedy Jr. has advocated closing whole sections of the Food and Drug Administration. These budgetary savings could help reduce the size of the budget deficit, but we’ll have to wait and see how it plays out.

Powell currently holds his appointment until May 2026.  He was asked twice during the press conference whether he would resign. He replied with a simple "no" when asked if he would resign if President Trump asked him to resign. When asked again if he or other board members could be fired by the President, he said, "No, it is not permitted by law." So, unless Powell is impeached by both houses of Congress—which is incredibly unlikely—he will certainly serve his term through 2026.

When a reporter asked Powell about the neutral rate, or the natural rate of interest, he said that it’s difficult to pinpoint. The natural rate was defined in the 19th century by Swedish economist Knut Wicksell. Powell acknowledged that we’ll eventually know the neutral rate “by its works”. Based on our models, we believe the neutral Fed funds rate is 3.85% right now, considering where US employment, inflation, and inflation expectations stand in the US. We think the Fed funds rate will continue to fall until it reaches that level of 3.85%.

As I predicted, the Fed cut rates by 25 basis points in November, bringing the effective funds rate down to 4.6%. We believe there will be another rate cut in December, bringing the effective Fed funds rate to 4.35%, which will be equal to the Australian cash rate.

We don’t think rates will stop there. We expect another rate cut on January 28th, bringing the Fed funds rate to 4.1%. Following that, there will be a Fed meeting on Saint Patrick’s Day, where we expect another rate cut, bringing the Fed Funds rate to 3.85% This is where our model suggests the neutral Fed funds rate should be.

Any changes to that forecast will depend on the direction of inflation, unemployment, and inflation expectations in the US. If inflation goes down, unemployment rises, or inflation expectations decrease, rates could be cut further.

Still for now, we think the bottom of the Fed funds rate will be 3.85% by March next year.

Interestingly, the Fed is not just cutting rates; it’s also doing quantitative tightening at a rate of $25 billion per month. That means the size of the Fed’s balance sheet is falling by $25 billion each month.

However, at that rate, it will take nearly 10 years for the Fed’s balance sheet to fall back to the $4 trillion it was at in 2019. So, while the Fed may continue cutting rates next year, quantitative tightening is likely to continue for many years to come.

Find out more
No items found.
November 6, 2024
6
November
2024
2024-11-06
min read
Nov 06, 2024
Navigating the US Election │Be Prepared
Tom Sartor
Tom Sartor
Senior Analyst/Strategist
A roadmap of possible US election outcomes and their context versus market fundamentals. Given that parts of the market look abnormally stretched, we think it’s prudent that investors should have a plan should market uncertainty escalate.

A roadmap of possible US election outcomes and their context versus market fundamentals.

Key points:

  • A benign US election process with a quick and clean result would be the least disruptive outcome for capital market but this appears to be a relatively low probably scenario.
  • Given that parts of the market look abnormally stretched, we think it’s prudent that investors should have a plan should market uncertainty and/or volatility escalate.

History shows that US equities in the very short term tend to trade flat into elections but then rally out the other side as investors have more certainty on forward policy and leadership. US equity markets appear to be in a mood to do the same in 2024, with typical seasonal strength into Christmas likely to become the market narrative should the election go smoothly. However, the current circumstances look less than typical.

History shows that US equities in the very short term tend to trade flat into elections but then rally out the other side as investors have more certainty on forward policy and leadership. US equity markets appear to be in a mood to do the same in 2024, with typical seasonal strength into Christmas likely to become the market narrative should the election go smoothly. However, the current circumstances look less than typical.

First let’s consider what a win might look like on either side. There is a mountain of opinion about what election outcomes might mean for the US. The reality is that no matter who becomes President, investors will face ongoing uncertainties about policies which have potential to mould the US economy. Should Harris prevail, it looks unlikely the Democrats would control the US senate, making the passage of reformative legislation more difficult. The “status quo” might actually be the most benign outcome. Should Trump prevail, there is greater uncertainty about whether pre-election policy rhetoric – particularly on high potential impact policies around trade tariffs – are actually enacted.

At this point it does look like the policies of both parties though would entail more Government spending than capital markets currently expect. This could re-assert upward pressure on US inflation and might mean that the pace of US rate cuts could be slower than markets currently hope.

It’s quite notable that the pricing of US Treasuries have reflected this very potential in recent weeks, with yields trending higher. It’s equally notable that equity market behaviour looks to be in disagreement with bonds, arguably disregarding risks around the US rates trajectory. Other market valuation metrics also look somewhat dislocated.

US 10-Year Treasury Yields

US credit spreads have narrowed to levels not seen since June 2007. This decline mirrors the strength in equities but also reflects expensive valuations and can indicate some complacency in the market's assessment of credit risk. Absolute US equity valuations are at decade highs. Equity valuations relative to bonds as measured by the equity risk premium look the most stretched, with the ERP at multi-decade lows below 1%. Stretched valuations does increase the market’s vulnerability to unforeseen events or uncertainty.

S&P500 - Equity Risk Premium

It's prudent to be prepared

The US is among the biggest success stories in the global economy. To achieve disinflation without much disruption to growth or employment is no mean feat. US corporate earnings have also been strong and resilient, projecting compound growth of 12-15%, which is really important here. However, several measures of capital market strength are looking stretched and/or abnormal with the disagreement reflected in bond yields the most notable. Getting US elections out of the way is typically good for markets. However, several various potential scenarios around the election could easily lift uncertainty and spike market volatility at current levels. Confirmation of the election process itself could include material delay, challenge, dispute and/or unrest. We think investors should prepare accordingly.

Domestic stocks, themes and opportunities that we have recently be advocating for investors include: trimming banks exposure, rotating exposure into resources (BHP & RIO), value in energy (Woodside), US rates leverage via James Hardie and opportunities in stocks on weakness in Lovisa and Eagers Automotive.

International stocks currently on the Morgans US focus list include Meta Platforms, Nike, Coca Cola, Starbucks, Honeywell and Berkshire Hathaway.


Morgans clients receive exclusive insights such as access to the latest stock and sector coverage featured in the Month Ahead. Contact us today to begin your journey with Morgans.

      
Contact Us
      
Find out more
No items found.
November 13, 2024
1
November
2024
2024-11-01
min read
Nov 01, 2024
The Month Ahead | 3 ways to play AI
Alexander Mees
Alexander Mees
Head of Research
We recommend investors start making sense of AI by considering stock opportunities in three distinct areas: artificial intelligence, digital infrastructure, and data networks.

Jensen Huang, the rockstar CEO of NVIDIA, recently described Artificial Intelligence (AI) as ‘the most transformative technology of the 21st Century’ which ‘will affect every industry and aspect of our lives’. The CEO of Alphabet, Sundar Pichai, went further, saying AI is ‘probably the most important thing humanity has ever worked on’. Amid all this hyperbole, it can be daunting to know where to start as an investor looking to get exposure to AI. We offer one framework for thinking about this in the Month Ahead for November. We recommend investors start making sense of AI by considering stock opportunities in these three distinct areas:

Artificial Intelligence Providers

It is no coincidence that the world’s leading Cloud Service Providers (Microsoft, Amazon, and Google) are leading the race to commercialise Artificial Intelligence and Large Language Models (LLMs), alongside that technological shapeshifter Meta Platforms. These companies are also known as ‘Hyperscalers’ due to their technical expertise in operating computing infrastructure at levels of complexity that would make your head spin.

The Hyperscalers are typically well funded and cash generative. Their ‘ownership’ of business and personal data puts them at the forefront of building, training, and ultimately monetising LLMs. Collectively, these companies are expected to spend a staggering US$700bn in capex over the next three years, the bulk of which relates to AI.

In many ways, Microsoft (NASDAQ: MSFT) is the most uniquely positioned. As the key supplier of business productivity tools in the world, it has the vast technical expertise, data and customer base best suited to benefit from the rise of AI. As more and more businesses embrace AI we expect they will embrace Microsoft’s AI offering and both parties should benefit. Microsoft reported its September quarterly result on Wednesday and indicated Microsoft AI is on track to be its fastest ever product to reach $10bn in annual recurring revenue (less than three years).

      
MSFT coverage report
      

Digital Infrastructure

Digital infrastructure companies power the data centres, cloud computing and research activities that are integral to the digital ecosystem and the rise of AI. Internationally the best-known name in the space is AI chip supplier NVIDIA, which is widely held to be best in class and a unique value proposition.

Enjoying all the benefits of the AI growth opportunity with less volatility are the operators of data centres. Data centres are facilities that store, process, and manage the vast amounts of data foundational to AI, ensuring secure and efficient data flow, backup, and recovery. The largest operators in the world are Digital Realty and Equinix. Digital Realty recently reported a record sales quarter during which it sold double the data centre capacity of its previous high and about four times more capacity than it usually sells in a quarter. This reinforces our view that the significant demand for cloud computing and AI-related digital infrastructure is going to unpin attractive returns and long-term growth.

Here in Australia, the data centre space gathered recent attention following the recent $23bn purchase of private data centre operator AirTrunk. In the listed arena, NEXTDC and Goodman Group are the largest data centre operators on the ASX. Our preferred exposure is NEXTDC (ASX: NXT). It has 17 operational data centres in Australia and nearly a dozen under construction or about to be built across Australasia and Asia.

      
NXT coverage report
      

Data Networks

AI needs a combination of technical expertise, computing power, data centre space and data. An extremely large amount of data is needed to train an AI agent or LLM. Once the training is complete the AI agent also needs to be given regular up-to-date data in order to remain relevant and useful. This is where traditional data networks (such as telcos like Telstra, TPG Telecom, Superloop and Megaport) come into play.

Traditional telecommunications companies will benefit from the astronomical growth of data around AI. Telstra for instance is building a specialist inter-capital network with a A$1.5bn capital budget to fund this project. However, our preferred exposure is through the more specialised and capital-light Megaport (ASX: MP1). Megaport is a global cloud connection network and the leading Network as a Service provider. It operates the largest data centre connection business in the world, connecting to 850 data centres through a fully automated, on-demand telco network. We think it is uniquely placed to help business move data globally and benefit from the growth of data related to both cloud computing and AI.

      
MP1 coverage report
      

Morgans clients receive exclusive insights such as access to the latest stock and sector coverage featured in the Month Ahead. Contact us today to begin your journey with Morgans.

      
Contact Us
      
Find out more
Research
There's been much discussion regarding Donald J. Trump's intention to increase tariffs on imports into the United States. Many economists have commented on how this would raise prices in the US and drive up inflation.

There's been much discussion regarding Donald J. Trump's intention to increase tariffs on imports into the United States. Many economists have commented on how this would raise prices in the US and drive up inflation. However, few have examined the strategy behind Trump's comments, which can be found in a book by his trade adviser, Dr Peter Navarro, titled *The New Mega Deal*. Released a few months ago in conjunction with the Republican Convention, it's surprising that so few economists discussing Trump's tariffs seem to have read it.

Navarro, who taught at Harvard before joining Trump’s first administration, previously ran the White House Office of Trade and Manufacturing Policy. His recent book lays out Trump's trade policy in detail, particularly between pages 26 to 29. Navarro highlights how countries trading with the US operate under the World Trade Organization's most favoured nation rule. He starts with the example of automobiles imported into the US, where the tariff is just 2.5%. In stark contrast, when US cars are imported into the European Union, they incur a 10% tariff—four times higher—and a 15% tariff in China. In Brazil, the tariff reaches 35%, despite all these countries facing a mere 2.5% tariff when exporting cars to the US.

Navarro then examines the case of rice. When rice from Malaysia is imported into the US, it pays a 6.2% tariff, whereas US rice entering Malaysia faces a hefty 40% tariff. He also notes that European milk imported into the US incurs a 15% tariff, while US milk going to the EU faces a staggering 67% tariff. From a strategic game theory perspective, Navarro argues that the WTO's most favoured nation rule provides little to no incentive for high-tariff countries to lower their tariffs, allowing them to maintain their tariffs while benefitting from lower US tariffs.

According to Navarro's analysis during his time in the Trump White House, there are 132 countries whose tariffs on products imported from the US are higher than the tariffs imposed by the US. He suggests that if these countries reduced their tariffs to match those of the US, it could lower the US trade deficit by nearly 10%. This insight is crucial for understanding Trump's negotiation strategy. Should these countries refuse to reciprocate, the US could increase its tariffs to match theirs, resulting in a similar reduction of the trade deficit.

This approach could potentially create hundreds of thousands of new manufacturing jobs in the US, thereby strengthening its industrial and defence sectors. Trump aims to pursue this strategy through the proposed US Reciprocal Trade Act, which was initially introduced in the House of Representatives on 24 June 2019 but was blocked by Democrats. If Trump is re-elected, his administration will likely attempt to pass this bill again. Interestingly, Trump has claimed that he does not actually need this legislation, which might be his way of setting the stage for negotiations, suggesting he could use the threat of higher tariffs to encourage other countries to lower their tariffs on American goods.

Find out more
No items found.
We believe that growth in this area will replace the growth in demand that has traditionally been provided by China, particularly for the kinds of products that Australia exports.

In recent weeks, we've been discussing growth in the Indo-Pacific, specifically Southeast Asia and India. We believe that growth in this area will replace the growth in demand that has traditionally been provided by China, particularly for the kinds of products that Australia exports.

In this issue I will examine some recent slides from the International Energy Agency's, World Energy Outlook report. The first slide outlines projections for world oil demand between now and 2030. Demand which is expected to reach just under 104 million barrels per day by 2030. Recently, oil demand has been growing by around a million barrels a day, but that growth has recently slowed to about 0.8 million barrels per day. Even with this slower growth, our projections suggest oil demand could reach 105 million barrels a day by 2030, indicating that the IEA estimates might be slightly conservative. Still, they still show a steady increase in demand for oil.

From 2015 to 2023, the biggest single increase in oil demand came from China, with an increase of 5 million barrels per day, followed by India, which saw growth of over 1 million barrels per day. Southeast Asia and Africa also contributed, each with increases of about 0.3 million barrels per day. Conversely, demand in Europe has decreased by about 0.9 million barrels per day, while North America has seen steady demand and Japan and Korea have experienced declines.

Looking ahead, the landscape of oil demand is changing significantly. The International Energy Agency notes that the rapid growth in oil demand in China has come to an end, largely due to the electrification of vehicles powered by a dramatic expansion of nuclear power and renewables. While oil demand in China may stabilise, there is a rapidly increasing demand in India, projected to grow by 2 million barrels a day. Southeast Asia and Africa will also experience growth, each by about 1.3 million barrels per day.

Between 2015 and 2023 the demand for liquefied natural gas (LNG) also rose. Between 2015 and 2023, the European Union saw a demand increase of over 100 billion cubic meters, followed by China with a growth of 74 billion cubic meters. India had smaller growth, while Southeast Asia's demand was flat. Japan’s demand fell.

The future looks different, with significant demand growth expected in the Indo-Pacific. From 2023 to 2025, China will still see a rise in demand of just under 50 billion cubic meters.

Indian LNG demand is projected to grow by about 54 billion cubic meters by 2035, and Southeast Asia, driven by increased manufacturing, is expected to see a rise of 104 billion cubic meters in demand by 2035. Japan is anticipated to see a decline in the demand for natural gas.

Overall, global LNG production is set to increase dramatically, from 600 billion cubic meters in 2024 to about 840 billion cubic meters by 2035. Australia, as a major LNG exporter, will play a crucial role in meeting rising demand, particularly driven by manufacturing growth in the Indo-Pacific, including in countries like Vietnam, the Philippines, and Indonesia.

Find out more
No items found.
No results found.