
Insights


The World Economic Outlook for 2025: Good growth with low inflation
Michael Knox looks at the global economic outlook for 2025, which shows moderate growth and inflation across major economies
I'm currently preparing my quarterly updates, which includes revising my outlook for the U.S, the Euro Area, China, India, and Australia, focusing on both GDP and inflation. When discussing inflation here, I am referring to the headline measure of CPI inflation.
Looking at the outlook for growth, it’s quite benign, and the same goes for inflation.
GDP Growth:
In 2024, the U.S. economy grew by 2.8%, but we anticipate it will slow down to about 2.3% in 2025. The Federal Reserve tightened monetary policy for an extended period to slow the economy to a level that wouldn't be inflationary. So, for this year, U.S. growth is projected at 2.3%, with expectations for 2% growth next year.
The model we use for U.S. GDP, is based on the Chicago Fed National Activity Index This shows significant fluctuations in growth projections. The pandemic shutdown drove growth much lower than the model predicted. As the economy recovered, there were large swings above the model's projections, particularly in 2021 when actual growth was much higher than expected, followed by a downturn in 2022. In 2024, growth was then higher than anticipated but is now aligning more closely with our model, which projects US growth at around 1.9% to 2.0%.
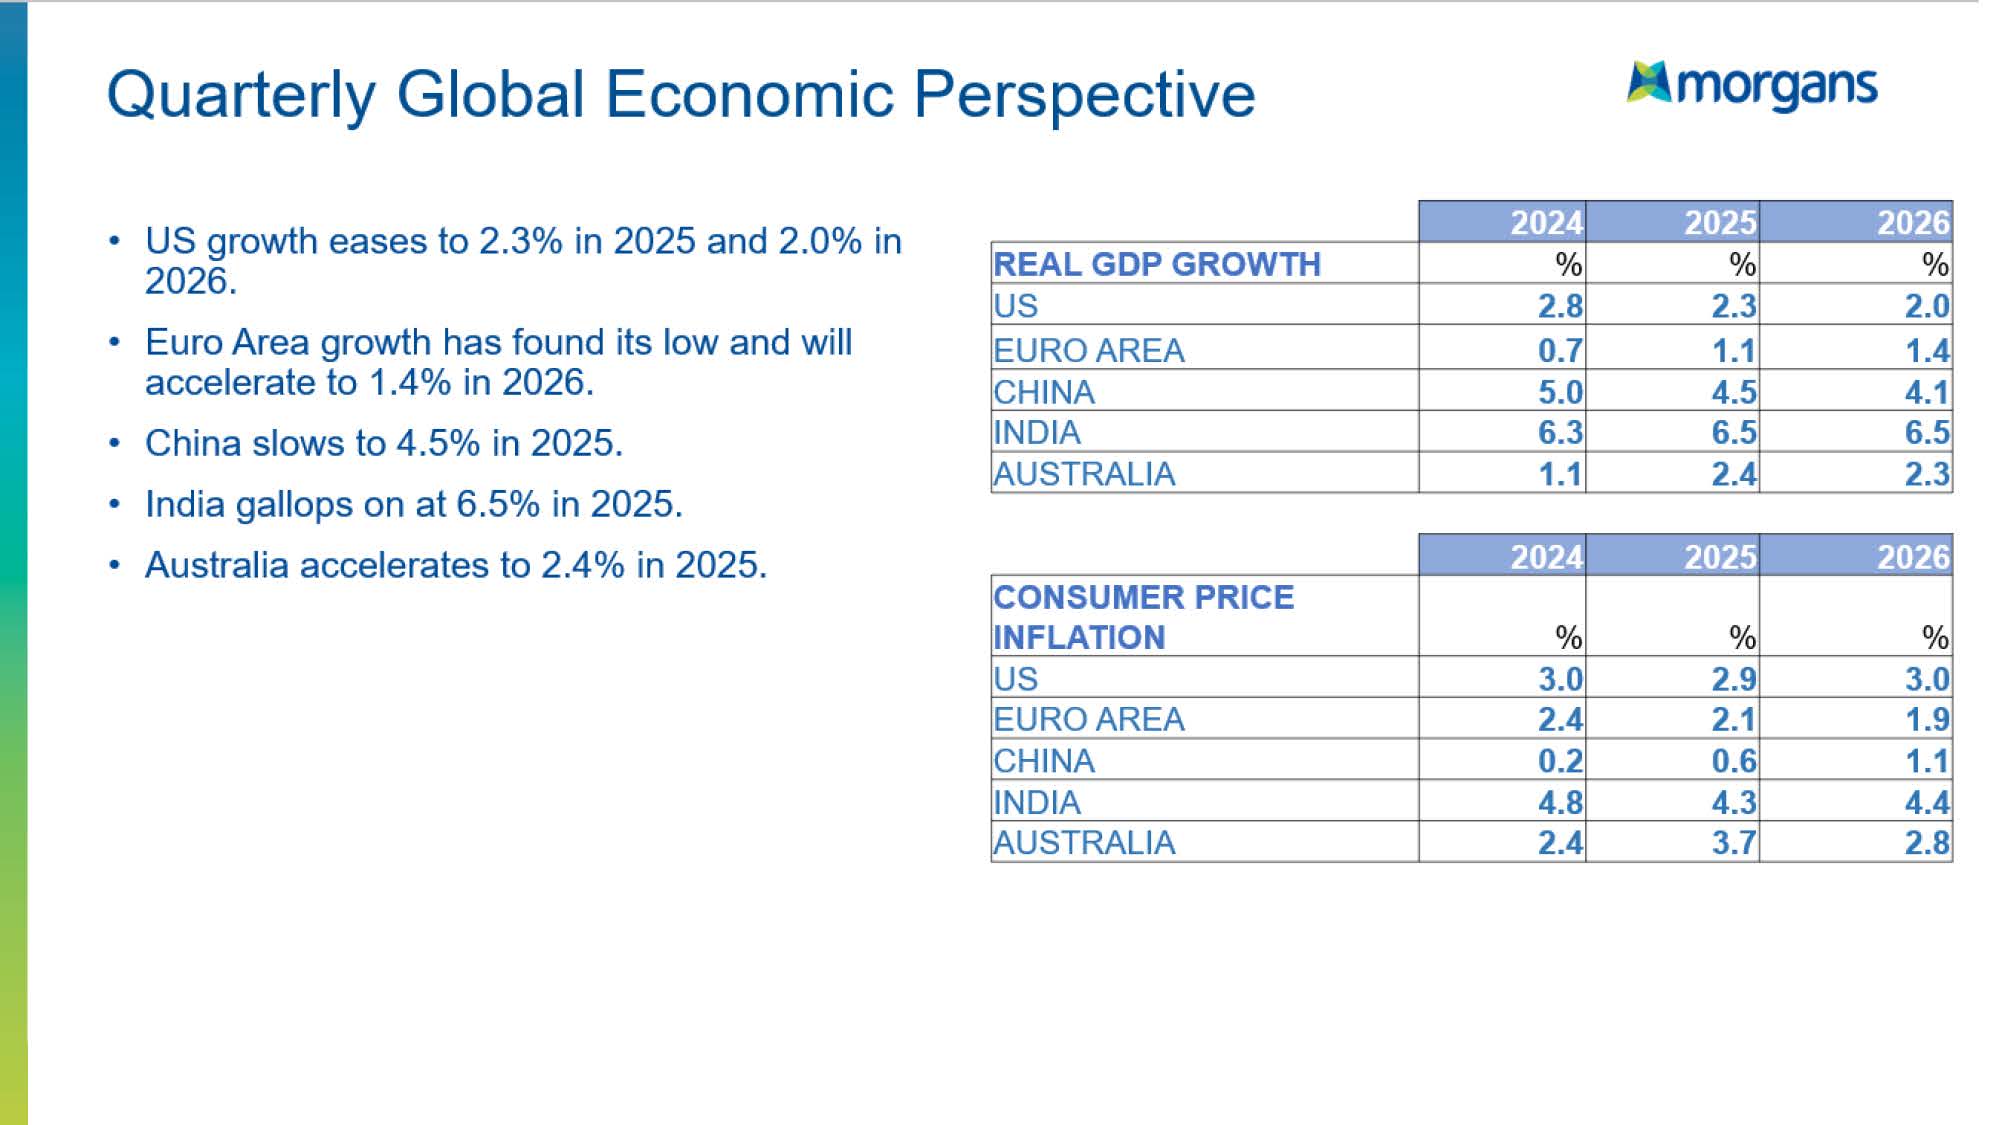
Turning to the Euro area, this has experienced a significant slump, with output in some countries even negative in prior years. However, growth picked up to 0.7% in 2024, and we're forecasting 1.1% for this year, with a slight increase to 1.4% next year. The key difference between Euro area growth and U.S. growth lies in population growth, which is about 1% faster in the U.S. than in the Euro Area. Much of the Euro Area’s growth is driven by productivity.
Officially China's growth was expected to be 5% last year. Amazingly , due to some unexpected lifts in output, it did ultimately reach 5%. Some believe that the actual growth rate was lower . This year, I expect growth to be around 4.5%, with a slight dip to 4.1% next year. For the second-largest economy in the world, a growth rate of 4.5% is still quite strong.
India continues to outpace other economies, with a growth rate of 6.3% last year. We forecast it will grow by 6.9% this year and next year as well.
Meanwhile, Australia has seen some interesting developments. Historically, Australia's economy follows the U.S. cycle, but this time, Australia is leading the U.S. cycle due to increased domestic demand driven by government spending. Growth in Australia was 1.1% last year, and we expect 2.4% this year, with growth stabilizing around 2.3% in the following years.
Inflation:
Now, focusing on inflation, we are primarily looking at Headline CPI inflation, which in the U.S. is projected to reach 2.5% over time. The Federal Reserve's target, however, is based on the Personal Consumption Expenditures (PCE) deflator, which is currently around 2.5% and should gradually decline to 2%. In the U.S., CPI inflation was 3% last year, projected to be 2.9% this year, and 3% again next year, before finally reaching the target of 2.5% by 2027.
In the Euro Area, inflation was 2.4% last year, with a slight decline to 2.1% this year. The Euro Area is targeting a CPI inflation rate of 2%, and we expect it to reach 1.9% by the end of 2025.
For China, inflation was much lower than expected last year, coming in at just 0.2%, compared to a target of 2%. It almost slipped into negative territory in the second half of the year. This year, Chinese inflation is expected to be between 0.6% and 1%, with a slight increase to 1.1% next year. The key issue in China is the lack of domestic consumption, which is necessary to drive economic growth.
India, which targets 4% inflation, saw 4.8% inflation last year. This year, inflation is expected to moderate to 4.3%, with a slight increase to 4.4% next year. India’s focus remains on growth rather than strict inflation control.
Australia’s inflation has been interesting due to government intervention. Last year, headline CPI came in at exactly 2.4%, but core inflation was much higher. This result was achieved through subsidies, particularly for electricity prices. If such subsidies continue into 2025, inflation will likely remain stable. However, without such support, inflation could rise to around 3.7% by 2025, potentially reaching 2.8% by 2026.
Overall, the outlook is one of moderate growth and moderate inflation across the major economies. Recession risks seem minimal, and the global economy is poised for steady, if unspectacular, progress in the coming years.
Morgans clients receive access to detailed market analysis and insights, provided by our award-winning research team. Begin your journey with Morgans today to view the exclusive coverage.
I'm currently preparing my quarterly updates, which includes revising my outlook for the U.S, the Euro Area, China, India, and Australia, focusing on both GDP and inflation. When discussing inflation here, I am referring to the headline measure of CPI inflation.
Looking at the outlook for growth, it’s quite benign, and the same goes for inflation.
GDP Growth:
In 2024, the U.S. economy grew by 2.8%, but we anticipate it will slow down to about 2.3% in 2025. The Federal Reserve tightened monetary policy for an extended period to slow the economy to a level that wouldn't be inflationary. So, for this year, U.S. growth is projected at 2.3%, with expectations for 2% growth next year.
The model we use for U.S. GDP, is based on the Chicago Fed National Activity Index This shows significant fluctuations in growth projections. The pandemic shutdown drove growth much lower than the model predicted. As the economy recovered, there were large swings above the model's projections, particularly in 2021 when actual growth was much higher than expected, followed by a downturn in 2022. In 2024, growth was then higher than anticipated but is now aligning more closely with our model, which projects US growth at around 1.9% to 2.0%.
Turning to the Euro area, this has experienced a significant slump, with output in some countries even negative in prior years. However, growth picked up to 0.7% in 2024, and we're forecasting 1.1% for this year, with a slight increase to 1.4% next year. The key difference between Euro area growth and U.S. growth lies in population growth, which is about 1% faster in the U.S. than in the Euro Area. Much of the Euro Area’s growth is driven by productivity.
Officially China's growth was expected to be 5% last year. Amazingly , due to some unexpected lifts in output, it did ultimately reach 5%. Some believe that the actual growth rate was lower . This year, I expect growth to be around 4.5%, with a slight dip to 4.1% next year. For the second-largest economy in the world, a growth rate of 4.5% is still quite strong.
India continues to outpace other economies, with a growth rate of 6.3% last year. We forecast it will grow by 6.9% this year and next year as well.
Meanwhile, Australia has seen some interesting developments. Historically, Australia's economy follows the U.S. cycle, but this time, Australia is leading the U.S. cycle due to increased domestic demand driven by government spending. Growth in Australia was 1.1% last year, and we expect 2.4% this year, with growth stabilizing around 2.3% in the following years.
Inflation:
Now, focusing on inflation, we are primarily looking at Headline CPI inflation, which in the U.S. is projected to reach 2.5% over time. The Federal Reserve's target, however, is based on the Personal Consumption Expenditures (PCE) deflator, which is currently around 2.5% and should gradually decline to 2%. In the U.S., CPI inflation was 3% last year, projected to be 2.9% this year, and 3% again next year, before finally reaching the target of 2.5% by 2027.
In the Euro Area, inflation was 2.4% last year, with a slight decline to 2.1% this year. The Euro Area is targeting a CPI inflation rate of 2%, and we expect it to reach 1.9% by the end of 2025.
For China, inflation was much lower than expected last year, coming in at just 0.2%, compared to a target of 2%. It almost slipped into negative territory in the second half of the year. This year, Chinese inflation is expected to be between 0.6% and 1%, with a slight increase to 1.1% next year. The key issue in China is the lack of domestic consumption, which is necessary to drive economic growth.
India, which targets 4% inflation, saw 4.8% inflation last year. This year, inflation is expected to moderate to 4.3%, with a slight increase to 4.4% next year. India’s focus remains on growth rather than strict inflation control.
Australia’s inflation has been interesting due to government intervention. Last year, headline CPI came in at exactly 2.4%, but core inflation was much higher. This result was achieved through subsidies, particularly for electricity prices. If such subsidies continue into 2025, inflation will likely remain stable. However, without such support, inflation could rise to around 3.7% by 2025, potentially reaching 2.8% by 2026.
Overall, the outlook is one of moderate growth and moderate inflation across the major economies. Recession risks seem minimal, and the global economy is poised for steady, if unspectacular, progress in the coming years.
Morgans clients receive access to detailed market analysis and insights, provided by our award-winning research team. Begin your journey with Morgans today to view the exclusive coverage.

What I'm looking at today is how the major campaign announcements we've seen in recent weeks, and those expected in future weeks, will affect the Australian budget deficit.
I think when the political history of this current period is written, significant emphasis will be placed on the long-term friendship between Prime Minister Anthony Albanese and the former Premier of Victoria, Daniel Andrews. This is a close friendship, which might even be referred to as a "bromance".
Andrews was a grand master politician. At the state level, he understood how his party worked and how to control it, knowing what to give different parts of it to ensure they stayed in line. He also understood how the budget cycle worked. Very significantly, he knew how to campaign, how to be a master of the campaign, and how to manage big project announcements, which in his case were always debt-financed. He was skilled at making announcements in such a way that they took the oxygen out of his opponent's campaign. Still, as I say, these projects were always deficit-financed. As a result, we saw Victorian debt levels rise relative to other Australian states.
Deficit spending was first analysed in the 1930s by Maynard Keynes. At that time, the major issue was deflation, meaning price levels were falling. As a result, real wages were rising, and people were being thrown out of employment. Maynard Keynes argued that running deficits would lift the price level, which would reduce real wages and push workers back into employment. This lead to a situation where employment rose, but living standards fell.
Just so, this current period of deficit spending, particularly in the US and to a lesser extent here in Australia, has driven down living standards and generated much of today's political sentiment.
The problem in Australia is that this debt will be paid down by younger generations who will pay a higher proportion of their income in taxes. As I mentioned earlier, further deficit spending will only worsen this problem of living standards; it will not make it better. The current government under Albanese is heading in this direction, with an increasing deficit and levels of debt.
A couple of months ago, Treasury released the Mid-Year Economic and Fiscal Outlook (MYEFO), which showed how future budget deficits and debt levels are moving compared to last year's budget.
According to the MYEFO, the deficit for the year ahead (2025-26) was expected to be $42.8 billion. However, that deficit rose by $4.1 billion to $46.9 billion. For the year after that (2026-27), the deficit was projected to be $26.7 billion but, according to MYEFO, increased by $11.7 billion to $38.4 billion. In 2027-28, the projected deficit of $24.3 billion from last year’s budget was project to rise to $31.7 billion. So, the deficit problem is worsening, and as expected, that means the debt problem is also getting worse.
In last year’s budget, the level of gross debt was expected to be $1.007 trillion for 2025-26. But in MYEFO, that expanded by $21 billion to $1.028 trillion. By 2026-27, the debt level is expected to expand by $36 billion, and the following year, by $49 billion. This shows that the situation is getting worse, not better.
Looking ahead to the election, given that Albanese has learned much from Daniel Andrews, we can expect to see the announcement of big projects. We've already seen the expansion of Medicare announced, and we're sure to get more before the budget is finalised.
The problem is that this situation of expanding deficits, which was a particular specialty of Daniel Andrews and is now a speciality of Anthony Albanese, will make the issue of living standards worse, not better. Let's see what further data we can get on this when the budget is released on 25 March.
Morgans clients receive access to detailed market analysis and insights, provided by our award-winning research team. Begin your journey with Morgans today to view the exclusive coverage.

Yesterday, the Reserve Bank of Australia (RBA) board met and reduced the Australian cash rate by 25 basis points to 4.1%. At the same time, they released the Quarterly Statement of Monetary Policy, which provides a broad range of outlooks for various variables affecting the Australian economy. The release of this report, on a quarterly basis alongside the RBA meeting, serves a similar function to the Summary of Economic Projections released by the Federal Reserve.
The RBA’s initial message was that even with the reduction in monetary policy, the outlook remains restrictive. However, according to our own model, A Cash Rate of 4.1% is not restrictive, but modestly expansive. Our model is based on 35 years of data.
The Quarterly Statement indicated that the outlook for the Australian economy is for considerable expansion. After last year’s GDP growth of only 1.1%, which economists consider a soft landing, growth is projected to pick up, with a forecast of 2% for the year to June 2025. This is followed by 2.4% for the year to December 2025 Growth continues between 2.3% and 2.5% over the following years. Even in 2027, growth is expected to remain above 2%. This represents a promising future for the Australian economy. Interestingly, business investment is not expected to be the main driver of this growth. Business investment growth for the year to December was zero and is expected to remain at zero for the year to June, only growing by 1.4% by the end of 2025. It seems that growth will accelerate only after the economy picks up speed. Household consumption is also forecast to increase slightly from 0.7% last year to 2.6% this year.

The primary factor driving the anticipated growth is Public Demand, largely funded by "other people’s money". Public Demand (Government Spending) grew by 4.9% in the year to December 2024 and is expected to grow by 5.3% or more for the year to June 2025, with projections of 4.3% for December 2025 and 4% for 2026. This growth in public demand, largely financed through public borrowing, includes Federal and State Government spending, particularly on infrastructure projects. While this expansion will stimulate demand, it will be paid for later by taxpayers.
The unemployment rate, currently at 4%, is expected to rise slightly to 4.2% mid-year, where it is anticipated to remain. The RBA has indicated that this increase in unemployment will help reduce inflation, although not to the target of 2.5%. Inflation is projected to fall from a trimmed mean of 3.2% for the year to December 2024, to 2.7% by June 2025. However, inflation is expected to stabilise at this level, not reaching the 2.5% target.
This raises an interesting question: why does the RBA believe that inflation can fall to the lower end of the 2-3% range without unemployment reaching 4.6-4.7%, as suggested by historical data? We believe that the significant import boom in Australia, with imports rising by 6.2% for the year to December 2024, has played a role. Import growth is expected to slow in the coming years. We think that but year's surge in imported manufactured goods at low prices has created an illusion of sustainable low inflation at the same time as relatively low unemployment.
Our analysis suggests that such low inflation is unsustainable unless unemployment rises to 4.6% or higher. This issue may resurface in the coming quarters as the true challenges of reducing inflation are revealed. However, for now, we can say that the Australian economy appears to have bottomed out. We’ve had our soft landing with 1.1% growth in December 2024, and growth is now accelerating, even if it is being driven by public spending. By the end of 2025, growth is expected to reach 2.4%, and the economy is set to maintain above 2% growth for the next several years. This represents a strong recovery, and the Australian economy appears poised for a period of better performance in the coming years.
Morgans clients receive access to detailed market analysis and insights, provided by our award-winning research team. Begin your journey with Morgans today to view the exclusive coverage.

The start of an easing cycle is upon us, but the path forward remains unclear, much like the post-pandemic economy. The debate now shifts from when the cycle commences to where the terminal rate for this cycle might land. Nonetheless, the first interest rate cut since November 2020 marks a definitive turning point for market sentiment and its impact on risk assets.
Rationale for the Cut
The RBA's decision for a 25bps cut reflects a view that inflation is sustainably moving back towards the Bank's 2-3% range. Three consecutive declines in quarterly core CPI from 4.0% to 3.2% in the December quarter afford some space for monetary easing.
In the February statement, the Board also highlighted some weakness in the demand side of the economy, with consumer and business sentiment subdued. Noting that "there has also been continued subdued growth in private demand and wage pressures have eased".
The Board was careful to point out that upside risk remains, suggesting that the labour market may be tighter than previously thought. So, while today’s policy decision recognises the progress on inflation, the Board remains cautious on prospects for further policy easing.
While Australia's economic stability presents minimal recession risk, the RBA must balance stimulus against potential overheating concerns from ongoing fiscal spending, as our economist Michael Knox points out in his recent piece.
What is priced in
Before today's announcement, futures implied a further 50bps interest rate cut, taking this cycle's terminal rate to 3.6% by December 2025. The RBA's forecast assumes three further cuts by June 2026 and a terminal rate of 3.4%. Given the uncertainties around the path of inflation, we think the RBA’s comments will unlikely alter the market outlook for interest rates.
Updated Economic Forecasts (Feb 2025)
.png)
Michael Knox is more cautious and believes there is limited scope for further rate cuts until unemployment rises from 4% to around 4.6%. The situation is complicated by fiscal policy. The Labor government has been expanding employment in sectors like the NDIS and other areas of the public service. This fiscal stimulus is preventing unemployment from rising to the level needed for inflation to fall. As a result, unemployment remains stuck at around 4%, and inflation remains too high for the RBA to cut rates further.
ASX performance following the first RBA rate cut (1996 – 2021)
The impact on investor sentiment is clear - historically, the ASX 200 has risen by an average of 4% in prior cycles since 1996 when the RBA proactively cut interest rates, excluding the periods of the Global Financial Crisis and the COVID-19 pandemic. As per prior cycles, we think this marks a definitive turning point for sentiment and is likely to support the positive underlying momentum in the equity market.
However, at a sector level, performance is mixed - Industrials, Healthcare, and Utilities generally outperform the ASX 200 in the three months following the first cut, while Financials, REITs, and Energy tend to lag.
.png)
Market implications
The multiples being paid by the market, particularly for interest rate-sensitive sectors, are high (ASX Industrials c22x vs the 10-year average of 19x), suggesting that some level of interest rate easing is already factored into prices. The prospect of two further rate cuts will help sentiment but is unlikely to create a step change in earnings forecasts. Every cycle is unique, so positioning is key for us, especially around industries and stocks that are best placed to benefit from this easing cycle.
Banks
A lift in front book volumes and more-buoyant mortgage demand needs stronger anticipation of lower product rates than a modest start to easing would bring at this stage. We still struggle to find value across the major banks (CBA – no major upside surprise supporting the price).
Consumption
Assuming a terminal rate of 3.60%, this equates to a savings of ~$300 a month for the average $666k loan size (ABS housing finance). This is expected to provide a modest boost to household consumption but the full impact is unlikely to be felt until 2H FY26. We prefer consumer linked stocks tied to lower-valued products (UNI, LOV) over housing-linked exposures at this point in the cycle.
Best ideas
Universal Store, Lovisa, Webjet Group
Property/Housing
As borrowing capacity improves, the housing market could see increased activity in lower-priced segments, alleviating some affordability issues that persist and offset inflation that is still evident in the cost of building. Banks are likely to actively promote fixed-rate mortgages ahead of potential further cuts.
Best ideas
James Hardie, Qualitas, Maas group
Morgans clients receive access to detailed market analysis and insights, provided by our award-winning research team. Begin your journey with Morgans today to receive exclusive coverage.

I was particularly interested last week by the comments from one of two U.S. economists I really like. These two economists are Jason Furman, who has emerged as a top figure on the Democratic side, and Kevin Hassett, a leading figure on the Republican side. When I have seen them both debate in person, Kevin Hassett usually seems to be enjoying the event more than Jason Furman. Maybe Hassett just has a sunnier temperament.
Kevin Hassett, served as Chair of the Council of Economic Advisers to the President Trump in his first Administration. In Trump's current administration, Hassett holds the position of Director of the National Economic Council. The National Economic Council is responsible for coordinating all major economic policy actions across the top departments. This is a significant role, far beyond just offering advice.
Hassett was discussing the strange movement in the U.S. payroll numbers published by the U.S. Department of Labor. Last week, the numbers came in one million lower than expected. In fact, it wasn't just one million lower for that month; it was one million lower for the previous four years. It appears that during the Biden administration, the U.S. Department of Labor had overestimated payroll numbers by a million workers per month for the entire period, and immediately after the Biden administration left office, those numbers were reduced by a million. I thought this was a particularly insightful observation, as it led me to update all my numbers for U.S. employment.

I decided to examine U.S. employment growth and its median and then compare it with Australia's figures. The data revealed that the median growth rate of employment in the U.S. is significantly lower than in Australia. The median growth rate of employment in the U.S. is specifically 1.65% per year. Including the most recent updates, the current year-on-year growth rate is now only 1.3%. In this case the Fed might cut monetary policy. Employment growth is an easy way to look at monetary policy, though it’s not my preferred model, which is based on unemployment, excess resources in the economy, and current inflation, as well as inflation expectations.
What these models show, both in the case of the Federal Reserve and the Reserve Bank of Australia (RBA)—is that the decision-making of central banks is not so much about where inflation is currently, but where they expect inflation to be in the future. This expectation is heavily influenced by the level of unemployment and, to some extent, expectations around that. However, in Australia, as I mentioned a couple of weeks ago, the problem is that unemployment isn't high enough to bring inflation to a low enough level to allow the RBA to reduce rates.
When we look at the U.S. case, employment growth is lower than the long-term median. In this case the Federal Reserve could consider cutting rates. My model, which explains 89.3% of the monthly variation in the federal funds rate since 1982, suggests that the equilibrium Fed Funds rate is 3.9%. This is lower than the current Federal Funds rate of 4.35%. This indicates that the Fed could cut rates anytime it wants to. However, what Jay Powell, the Chair of the Federal Reserve, said at the last meeting was that he thought monetary policy was in a satisfactory position for now. Still, our model suggests that a rate cut could happen soon, as future inflation is expected to be lower than current inflation.
The situation in Australia is different. The median employment growth rate in Australia is higher than in the U.S. The median in Australia stands at 2.1%. This is higher than the U.S. rate of 1.65%. Right now, Australia's rate of employment growth at 2.8% is higher than its long-term median. This is not the usual circumstance in which the RBA could be expected to cut rates. The reason for this is that employment is growing fast is due to the Government adding more workers to the public sector, particularly in the National Disability Scheme.

When we run our model for Australia, it explains 89.4% of the monthly variation of the cash rate since 1992. This is when the Australian cash rate first came into existence. The model suggests that the equilibrium rate is 4.41%, which is slightly above the current Australian cash rate of 4.35%. Based on where future inflation is expected to go, and considering the current level of unemployment, it is highly unlikely that the RBA will cut rates in the near future.
I know that this view doesn't align with the consensus, but I'm comfortable with that, as I often do better when I’m not in line with the majority opinion. The problem is that, as I shared a couple of weeks ago, historical data on the relationship between unemployment and inflation in Australia shows that over the past decade, unemployment needs to reach 4.6% or higher for inflation to be sustained at a level of 2.5%. Australian headline Inflation is falling, and Treasurer Jim Chalmers has been influencing that, as we know from the subsidies on electricity.
However, the RBA's decision will be based on where it expects future inflation to be, and my expectation is that we won't reach the 2.5% target for some time. Consequently, the RBA is unlikely to cut rates at its next meeting.
Morgans clients receive access to detailed market analysis and insights, provided by our award-winning research team. Begin your journey with Morgans today to view the exclusive coverage.

Last week, I discussed how Trump was using tariffs in economic policy. I explained that the administration aims to pass a significant, comprehensive bill: an omnibus bill, which includes the Reciprocal Trade Act; reduces the corporate tax rate to 15% and imposes a 10% revenue tariff by April. I also showed that, despite commentary to the contrary, this tariff revenue was not inflationary, contributing a maximum of 0.8% to the US Consumer Price Index (CPI).
However, this week what we've seen is that Trump has used tariffs not for economic purposes but rather for social policy, in attempting to address the social crisis in the United States. This social crisis helps explain much of how Trump was elected and why he now has substantial support.
This situation began in 2000 when China entered the World Trade Organization, which allowed its exports to enter the US market. At the time, tariffs were exceptionally low, around 1–2%.
Over the next decade, the US experienced deindustrialisation. 12 million American workers losing their jobs and never got them back. This created a significant social crisis in the US, contributing to a social collapse. This collapse led to a massive increase in drug dependency, particularly within the American working class. A key work on this issue was written by Nobel Prize winners, Sir Angus Deaton and his wife Anne Case in 2020, titled Deaths of Despair.
In the book, Deaton points out that the US overdose deathrate increased from under 20,000 before 2001 to 92,000 in 2020. Overdose deaths rose further to 108,000annually by 2024. Notably, young men are twice as likely to die from these drug overdoses as young women.
Peter Navarro, Senior Counsel Trade and Manufacturing in the Trump administration, made his career at Harvard researching American trade with China. He claims that 76,000 of those drug deaths are directly linked to fentanyl use. From a social policy perspective, Trump's recent actions, including threatening to impose a 25% tariff on Mexico and Canada within a month and introducing a 10% tariff on China, reflect a shift towards addressing the flow of fentanyl into the US. This is not simply a trade war but, as Navarro asserts, a "drug war" aimed at reducing the influx of fentanyl and fentanyl-laced drugs.
In response to these threats, Canada has pledged $1.3 billion to police its border, and Mexico has committed 10,000 troops to patrol its border. I would bet that no 25% tariffs will be imposed on Mexico and Canada in fact, I am highly confident of this. Fentanyl, which is involved in most drug-related deaths, primarily originates from Mexico and is produced with chemicals from China. The 10% tariff in China could be a precursor to a similar revenue tariff later in the year as part of the omnibus bill. Remember, Biden before he left office, already levied a 100% tariff on Imports of Chinese Electric Vehicles into the US.
Historically, during Trump's first term, Trump had a meeting with Chinese President Xi Jinping, who promised to reduce the flow of basic chemicals to Mexico that were used to produce fentanyl. However, in response to the latest 10% tariff, China has stated that "fentanyl is a US problem "and has declined to cooperate as it had promised in the past.
The key question now is whether US tariffs on China will harm Australian exports to China. Australia's Iron Ore Exports to China are valued at $84 billion annually. China's steel Industry is the largest in the world.
Will US Tariffs on China damage Chinese steel exports? When we examined Chinese exports of steel last year, we found that very little Chinese steel is exported to the US. According to US data, the majority of Chinese steel is exported to the Indo-Pacific, with Vietnam being the largest importer (at 9.96%), followed by South Korea (9.1%), Thailand (5.3%). the Philippines (5.2%), Indonesia (4.5%), Türkiye (4.4%), The UAE (4.0%) and India (3.2%). The amount of Chinese steel sent to the US is minuscule. Therefore, it is difficult to see how any US tariff on Chinese steel would have a significant impact on Australian exports to China.
Morgans clients receive access to detailed market analysis and insights, provided by our award-winning research team. Begin your journey with Morgans today to view the exclusive coverage.


