This article is a reworking of Michael Knox’s full presentation, to view the un-edited presentation, please view the video above.
Today I want to talk about the RBA outlook that was provided in the Statement on Monetary Policy, specifically Table 3.2, the detailed baseline forecast table.
This table is based on surveys of economists across the industry, including those from large investment institutions. The survey is conducted once a quarter and covers forecasts for unemployment, GDP growth, public spending and, of course, the cash rate. It provides a broad insight into what economists believe about where the Australian economy is heading.
The outlook released this week was, to me, quite unique. I want to explain why.
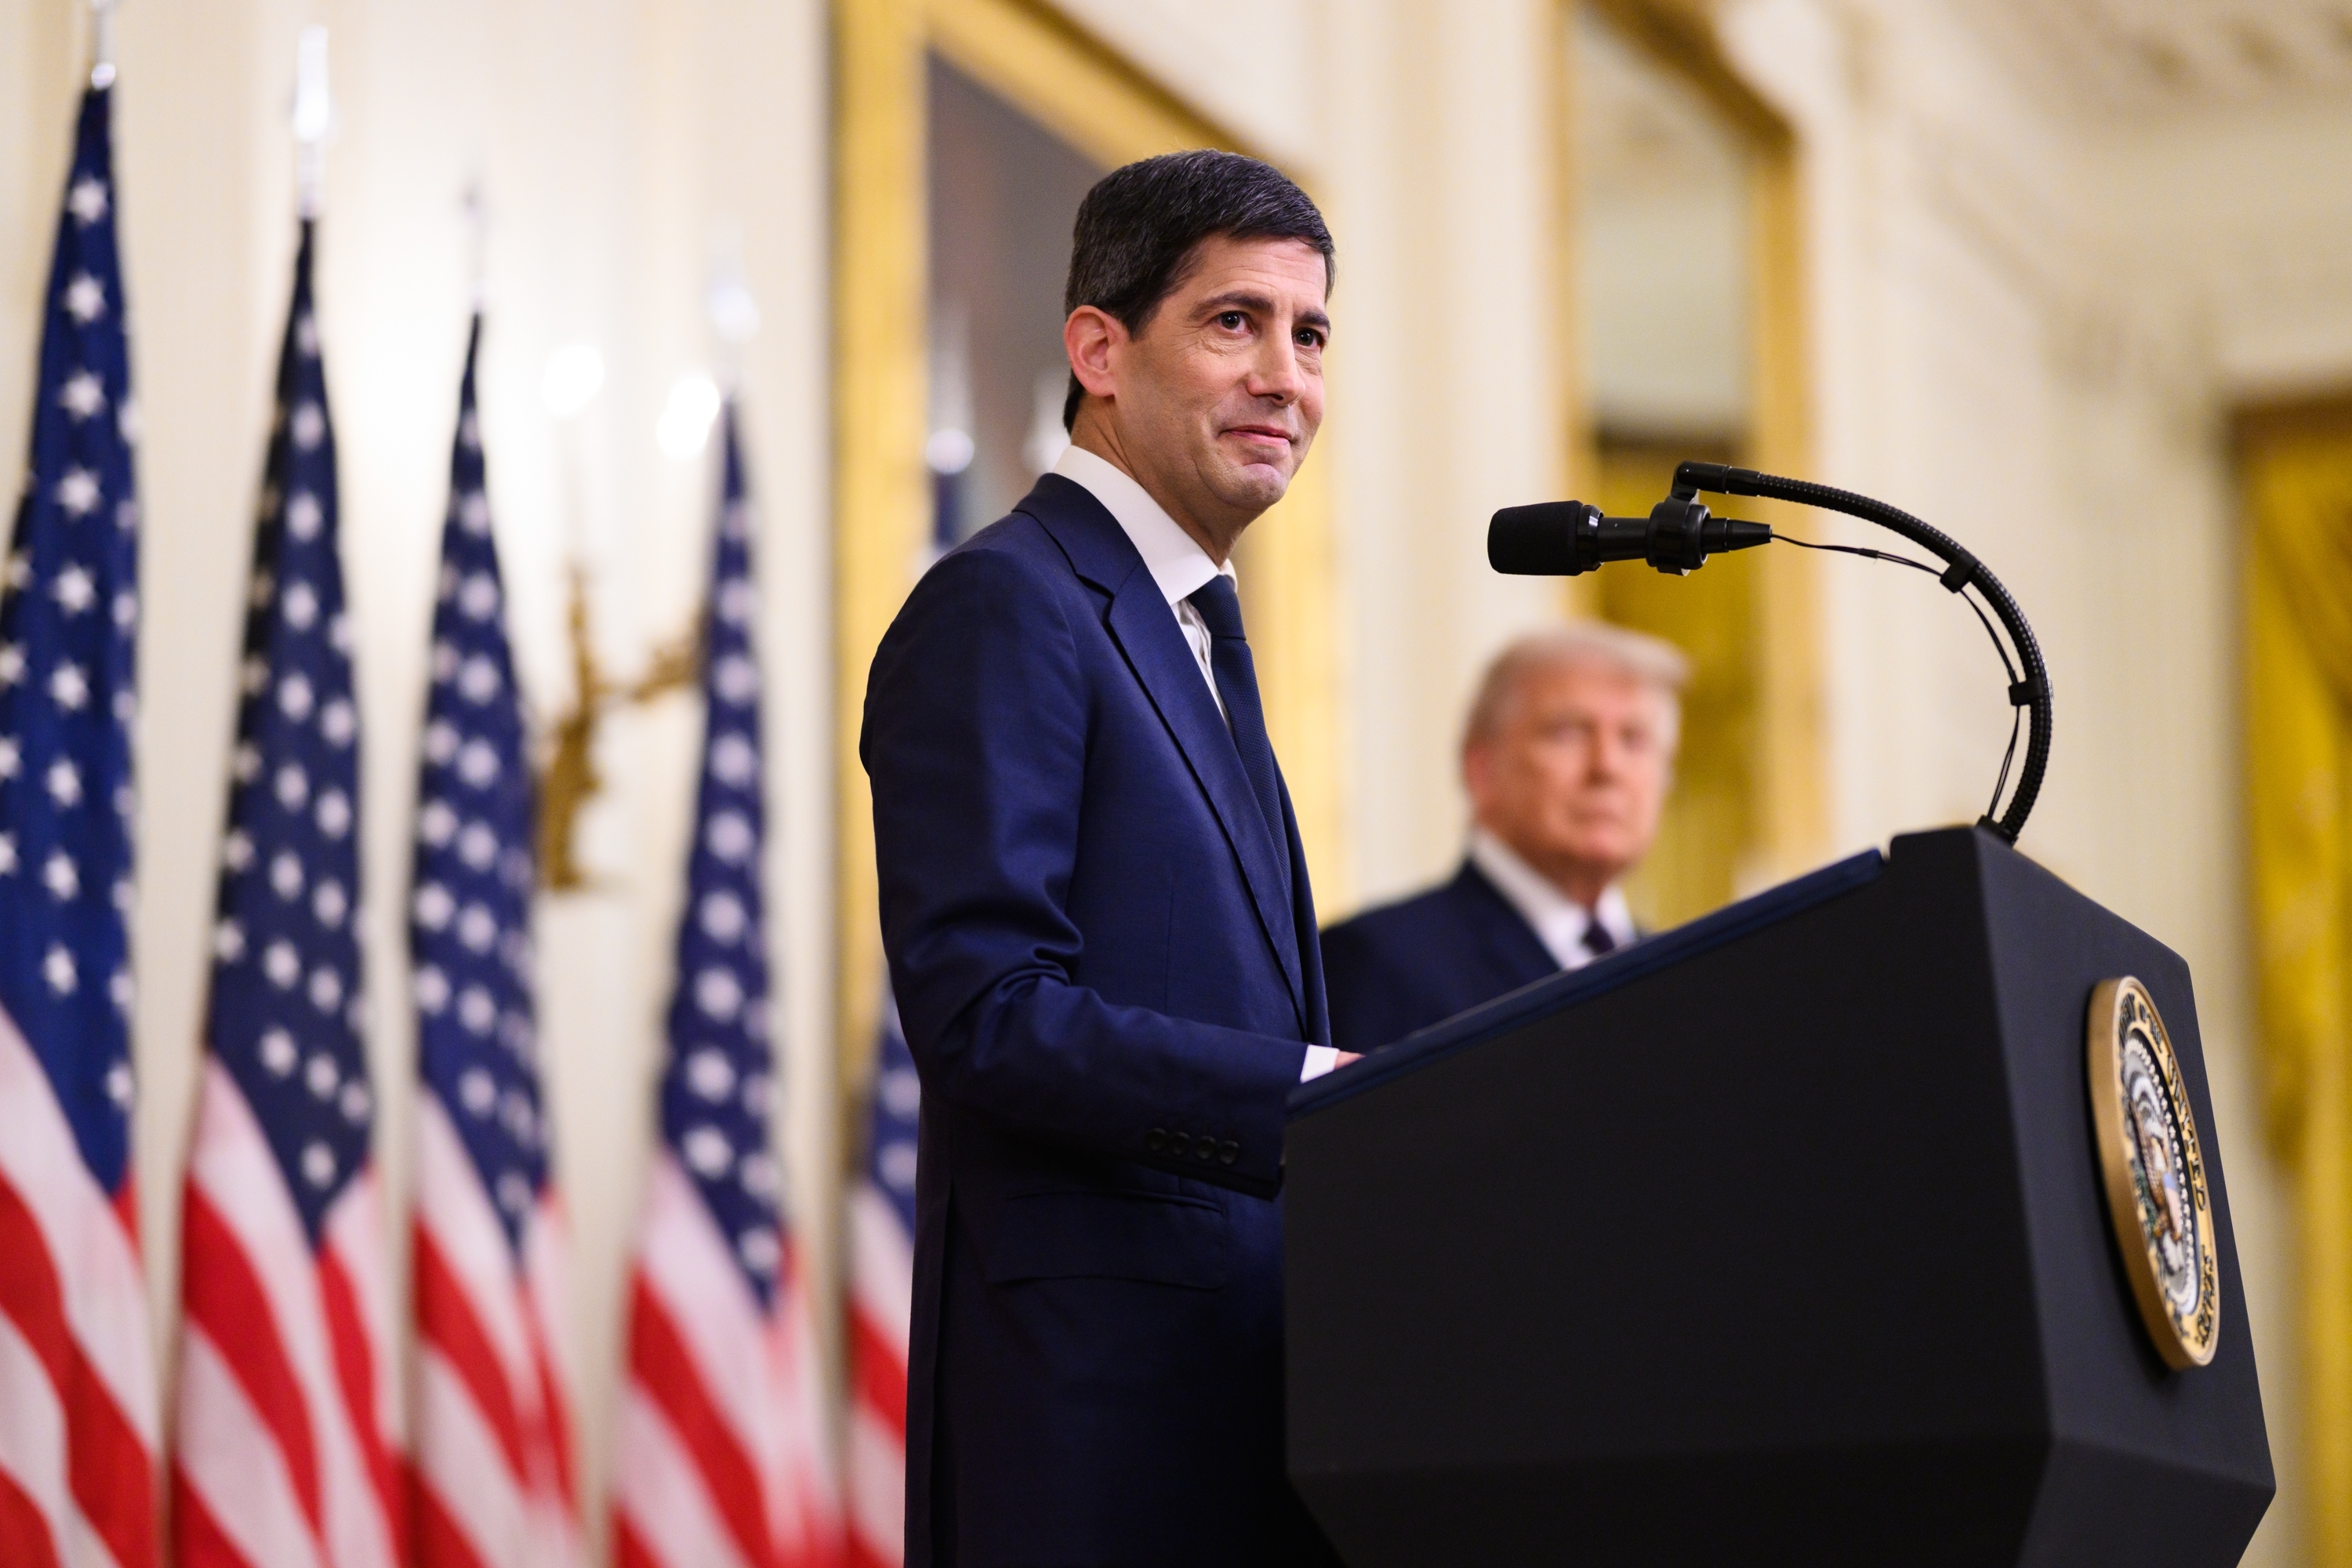
I think it is unique because Anthony Albanese, our current Prime Minister, is the leader of the left faction of the Labor Party. That is quite different from figures such as Paul Keating, who was from the New South Wales right faction. Keating strongly believed s in privatising public assets. In contrast, Anthony Albanese believes very much in public ownership and in expanding that public ownership, including in areas such as housing.
An example of this is the five per cent deposit scheme, where first home buyers can purchase a house but a significant portion of the equity in that property is held by the government. As this program expands, the government will continue to own an increasing share of the Australian housing stock.
In my view, understanding this growing government influence and ownership is important for understanding what is happening in the economy, including movements in the Australian dollar. Some of the data now being released reflects developments that are, in my professional lifetime, first-time events.
Turning to the outlook for the cash rate, the survey indicates that by the end of this year the Australian cash rate is expected to rise to around 4.7 per cent. What is most interesting, is not the peak cash rate but what happens after the cash rate peaks . Normally , interest rates will rise and then eventually fall. In this outlook, which runs through to mid-2028, rates rise but never come back down. They rise from here to around 4.7 per cent and are still at that level at the end of the forecast period in 2028.
There is, of course, no such thing as a true consensus of 4.7 per cent cash rate . Half the economists believe rates will peak around 4.85 per cent, and the others believe the peak will be around 4.6 per cent. What is striking is that none of the forecasts show rates eventually falling. Normally, at some point in these scenarios, you would expect to see rates begin to ease, and that simply is not happening.
The reason for this becomes clear when we look at the continued growth in public demand, that is, demand from the government sector. We have talked before about the boom in public demand occurring alongside what is effectively a private sector recession. The survey data shows this trend continuing and intensifying.
If we compare growth in public demand with GDP growth in the December quarter last year, public demand grew by 2.4 per cent while GDP grew by 2.6 per cent. In that period, public spending actually fell slightly relative to GDP. However, from that point onward, public spending consistently outpaces GDP growth.
In the period to June 2026, public demand is forecast to rise by 3.7 per cent while GDP grows by only 1.9 per cent. In the December period, public demand rises by 3.1 per cent compared with GDP growth of just 1.3 per cent. The same pattern continues into June 2027, with public spending rising by 2.8 per cent and GDP by 1.3 per cent, and again in December 2027, when public spending rises by 2.3 per cent against GDP growth of 1.4 per cent. Finally, in the period to June 2028, public spending rises by 2.1 per cent while GDP grows by 1.4 per cent.
What is happening, quarter after quarter, is that public spending continues to rise relative to GDP. The consequence of this is that interest rates rise to what each forecaster believes is the appropriate peak, whether that is 4.6 per cent or 4.85 per cent, and then they never come back down. That is an absolutely extraordinary outcome.
Despite GDP remaining positive, the sustained period of high interest rates has real consequences. By the second half of 2027, the data shows that there is a slump in dwelling investment. Private sector dwelling investment continues to fall and declines again by the middle of 2028, falling by a further 1.1 per cent.
In effect, the growth in public spending relative to GDP is driving interest rates higher and keeping them there. The result is that by the end of the forecast period in 2028, Australia is facing a slump in housing construction. It is an extraordinary situation where, despite heavy public involvement and spending in housing, the outcome is that everyone loses. The boom in public spending keeps interest rates high, and any meaningful expansion in housing construction is pushed far into the future.
Want to discuss how this impacts your portfolio?
DISCLAIMER: Information is of a general nature only. Before making any financial decisions, you should consult with an experienced professional to obtain advice specific to your circumstances.