Research notes

Stay informed with the most recent market and company research insights.

A man sitting at a table with a glass of orange juice.

Research Notes

Still working through a few kinks

Bapcor
3:27pm
September 1, 2025
BAP delivered a weaker FY25 result, with underlying NPAT down -8.4% to A$80.4m, weaker margins within the typically resilient Trade segment (2H -190bps hoh), and continued underperformance within Retail (2H sales -5.9% on pcp). FY25 was a year of disruption as BAP worked through a large-scale restructuring and simplification program. Positively, some benefits are starting to be realised (~A$27.5m net cost benefit in FY25), which should lead to improved operational performance in the core Specialist Wholesale division in FY26. Despite progress, ongoing underperformance within Retail/NZ (2H sales -5.9%/-4.6%) and weakness within Trade's 4Q (May/June market share losses) continued to significantly detract from earnings (2H NPAT -14%). While BAP is making progress on its turnaround program, the absence of a trading update/FY26 guidance, ongoing Board uncertainty, and expectations for a 2H earnings skew sees us preferring to wait for clearer evidence of an earnings base. HOLD.

Not getting worse, with a recovery pending

PeopleIn
3:27pm
September 1, 2025
FY25 was a challenging year for PPE, with normalised EBITDA down 10% (vs pcp). Whilst several operational metrics look to be stabilising, the result was light on forward guidance, albeit management did note that it remained well-positioned to benefit from a potential Queensland infrastructure boom. The balance sheet continues to improve, with net debt declining to $27.4m and M&A returning to the agenda. The stock trades on an undemanding PER of c.9x, with EPS arguably approaching a trough. To this end, we see earnings growth driving share price appreciation through FY27/28, with any turnaround unlikely to be visible until 4QFY26. Hence we reiterate our Speculative Buy rating with a $1.00/sh price target.

Back on track

SiteMinder
3:27pm
September 1, 2025
SDR’s result was in line with expectations. A strong acceleration in ARR growth in the 2H25, whilst delivering positive underlying FCF, was the key positive takeaway. If SDR can deliver FY26 organic revenue growth in line with FY25 ARR growth of ~27% and a mid-single-digit FCF margin, this would see the stock deliver Rule of 40 of +30% in FY26. If achieved, we think this should drive further upside from here. Upgrade to ACCUMULATE.

FY25 Result

Catalyst Metals
3:27pm
September 1, 2025
CYL delivered impressive FY25 financials following a year of operational consistency, value accretive organic growth and portfolio optimisation via M&A. Record gold prices coinciding with a growing production profile enabled CYL to deliver record revenue (+43% pcp), EBITDA (+208%), EBIT (+402%) and NPAT (+15%). Looking ahead to FY26, we assume continued production growth underpinned by Old Highway, Trident and K2 operations. Our growth forecasts remain consistent with CYL’s initial 200kozpa plan. We maintain our previous elevated growth CAPEX assumptions, however, note that FY26 guidance has yet to be formally announced. Following sustained elevated gold prices and a surge past US$3,400/oz we increase our spot valuation scenario to US$3,250/oz (previously US$3,000/oz). We maintain our BUY rating, target price A$8.82ps (previously A$6.75ps). The increase being a function of our revised spot scenario.

Cost-out complete, FUA growth in focus

Income Asset Management Group
3:27pm
August 31, 2025
It was a transitional year for IAM, seeing a substantial cost-out initiative undertaken along with the transition of its administration to Perpetual Corporate Trust. 27% FUA growth to A$2.4bn helped drive a 22% uplift in revenue to A$17.2m for FY25. Our price target of A8.4cps (unchanged) has us retaining our SPECULATIVE BUY recommendation.

A tale of two halves

Camplify Holdings
3:27pm
August 31, 2025
Camplify (CHL) has released its FY25 result. As expected, it was a tougher year overall for the group given both sector-specific impacts and company-specific disruptions which saw GTV and revenue decline ~16% and 12% respectively. However, we note an improved trajectory in the 2H, along with +8% growth in future bookings (~A$23m). We make several changes across our forecast period (details overleaf). Our DCF/Multiples-derived price target remains unchanged at A$1.05. Buy.

Outlook softened but momentum should improve

ReadyTech Holdings
3:27pm
August 31, 2025
RDY’s FY25 result was softer than consensus expectations, however Underlying NPATA of $17.3m was broadly in line with MorgF. FY26/27 guidance was downgraded, and implies a gradual step-up in run-rate as NRR improves (off a challenging FY25) through cloud migration in local government and delivering on its Enterprise wins/pipeline. Whilst we downgrade our EBITDA forecasts by -12.5% in FY26-FY27F reflecting revised guidance, we see the buildup into FY26 as being manageable. Our target price is reduced to $3.00/sh (prev. $3.45/sh), and we retain our BUY rating.

Hoping fish oil prices will improve

Nufarm
3:27pm
August 31, 2025
NUF’s trading update was weaker than consensus expected. Holding over Omega-3 inventory means that net debt is now materially higher than expected and is far too high (ND/EBITDA 3x). Unfortunately, this will likely result in NUF selling the best part of the company (Seed Technologies) to reduce it. NUF said that the strategic review of Seed Technologies is progressing. Given NUF is targeting ND/EBITDA of 2.0x by the end of FY26, this would imply that it is looking to deliver a material improvement in FY26 EBITDA and free cashflow. In our view, NUF is in the too hard basket until we know what this company consists of moving forward and it gets its leverage ratios down to more acceptable levels.

Consistent Delivery

Kina Securities
3:27pm
August 29, 2025
KSL’s 1H25 underlying NPAT (A$57m) was +16% on the pcp, and broadly in-line with MorgansE (A$56m).  This was a clean, solid result in our view. The only slight negative was underlying cost growth remaining high (+10% on the pcp), but this was matched by revenue growth.  We lower our KSL FY25F/FY26F EPS by 1%-5% on slightly higher cost growth than previously forecast. Despite this our valuation rises to A$1.67 (previously A$1.46) with our earnings changes offset by a valuation roll-forward. We also now lift the PE multiple applied in our SOTP’s valuation (7x vs 5.5x previously). With >20% upside existing to our PT (A$1.67), we maintain our BUY recommendation. We lower our KSL FY25F/FY26F EPS by 1%-5% on slightly higher cost growth than previously forecast. Despite this our valuation rises to A$1.67 (previously A$1.46) with our earnings changes offset by a valuation roll-forward. We also now lift the PE multiple applied in our SOTP’s valuation (7x vs 5.5x previously). We believe this is warranted based on the company’s consistent earnings growth over time and its current ROE (17%).

FY25 Earnings: Showing us the revenue ramp-up

NEXTDC
3:27pm
August 29, 2025
NXT’s FY25 result in line with expectations as was FY26, but FY27 was higher. Highlights of the result include: 1) a slide which finally shows investors the revenue ramp-up profile of NXT’s contracted MWs (it’s faster than anticipated so upgrades forecasts); 2) the pipeline is larger than ever (~2 GWs in NSW alone); and 3) setting up a partnership in Japan and Joint Ventures for S4/S7 will lower NXT’s equity requirements (relative to 100% self-funding). While none of these items are totally new, collectively they represent good reasons for the share price to rally strongly. We lift FY26F EBITDA by 2% and FY27 by 23%. We also lift our capex forecasts. The net result is our target price lifts to $19.00 per share from $18.80.

News & insights

The Wall Street Journal of 21 August 2025 carried an article which noted that Ether, a cryptocurrency long overshadowed by Bitcoin has surged in price in August

The Wall Street  Journal of 21 August 2025 carried an article which noted that Ether, a cryptocurrency long overshadowed by Bitcoin has surged in price in August.

The article noted that unlike Bitcoin, there was not a hard cap on Ether supply, but the digital token is increasingly used for transactions on Ethereum , a platform where developers build and operate applications that can be used to trade, lend and borrow digital currencies.

This is important  because of the passage on 18 July 2025 of the GENIUS act which creates the first regulatory framework for Stablecoins. Stablecoins are US Dollar pegged digital tokens. The Act requires  that  Stablecoins , are to be to be fully  backed by US Treasury Instruments  or other  US dollar assets .

The idea is that if Ethereum becomes part of the infrastructure of Stablecoins , Ether would then benefit from increased activity on the Ethereum platform.

Tokenized money market funds from Blackrock and other institutions already operate on the Ethereum network.

The Wall Street journal  article  goes on to note that activity on the Ethereum platform has already amounted to more than $US1.2  trillion this year ,compared with $960 million to the same period last year.

So today ,we thought it might be a good idea to try and work out what makes Bitcoin and Ether  go up and down.

As Nobel Prize winning economist  Paul Krugman once said "  Economists don't care if a Model works in practice ,as long as it works in theory" .  Our theoretical model might be thought as a "Margin Lending Model" . In such a model variations in Bitcoin are a function of variation in the value of the US stock market .

As the US stock market rises, then the amount of cash at margin available to buy Bitcoin also rises .

The reverse occurs when the US stock market goes down .

Our model of Bitcoin based on this theory is shown in Figure 1  .  We are surprised that this simple model explains 88% of monthly variation  in Bitcoin since the beginning of 2019.
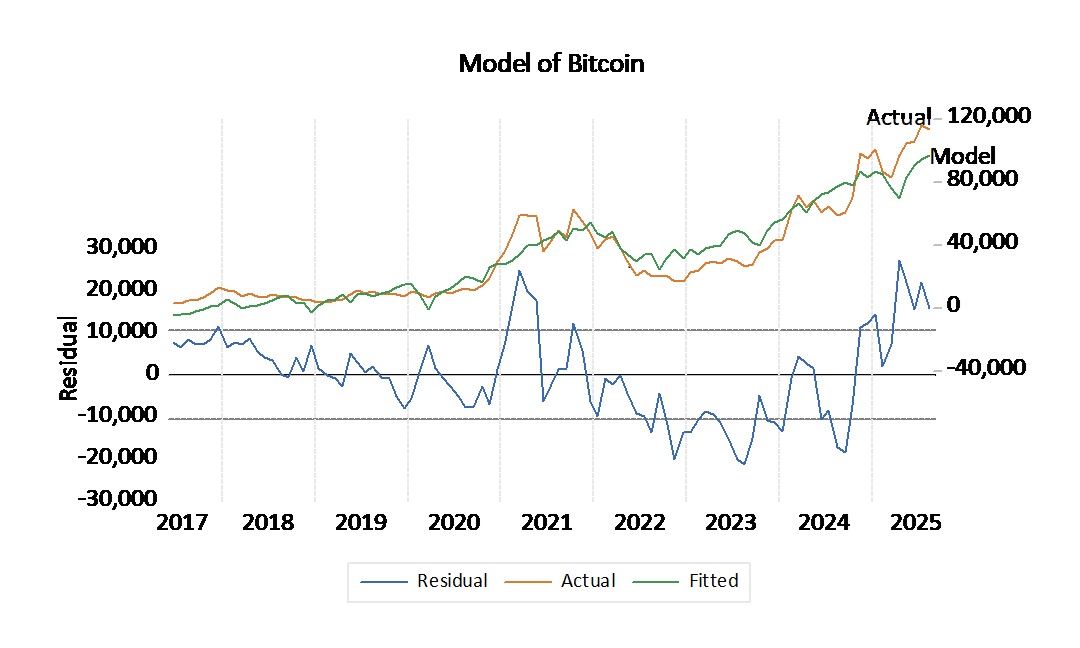
Figure 1 - BTC

At the end of August  our model  told us that when Bitcoin was then valued at $US112,491 , that it was then overvalued by $US15,785 per token.

Modeling Ether is not so simple . Ether is a token but Ethereum is a business.  this makes the price of Either sensitive to variations in conditions in the US Corporate Debt Market.

Taking that into account as well as stock market strength, gives us a model for Ether which is shown in figure 2.
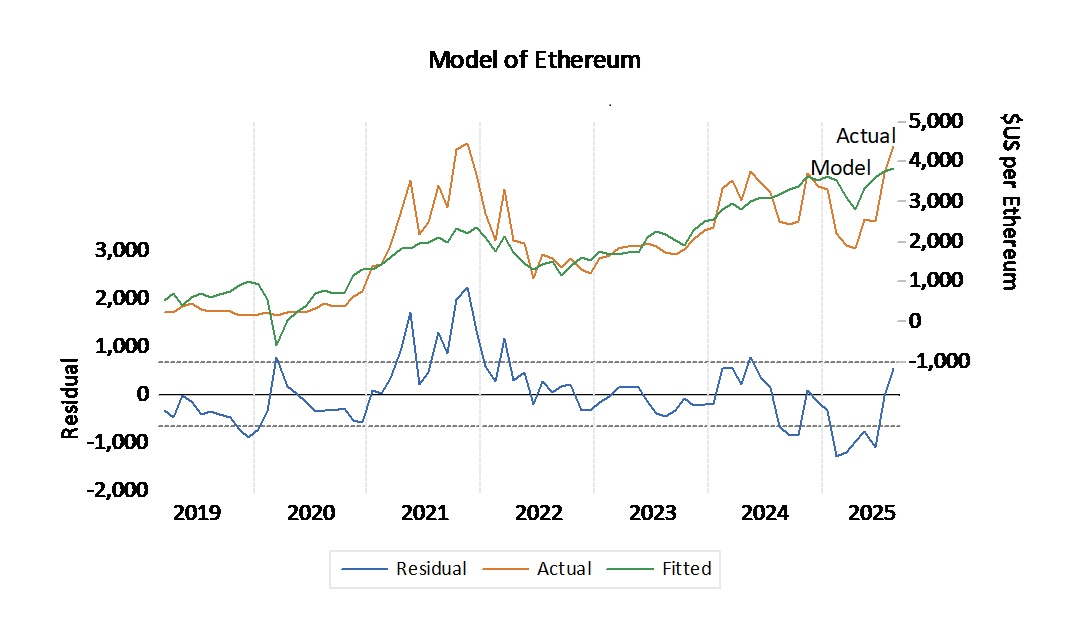

Figure 2- Ethereum


This model explains 70.1% of monthly variation since the beginning of 2019. Our model tells us that at the end of August, Ether at $US 4,378per token was $US 560 above our model estimate of $US3,818.00 . Ether is moderately overvalued.

So neither  Bitcoin nor Ether are cheap right now.

ETFs for each of Bitcoin and Ether are now available from your friendly local stockbroker .

But right now , our models tell us that neither of them is cheap!

Read more
Uncover insights from Jackson Hole: Jay Powell’s rate cut hints, Fed’s soft landing concerns, and dire demographic trends. Analysis by Morgans’ Chief Economist.


There is more to what happened at Jackson Hole than just the speech by Jay Powell.

In my talk last week ,I said that our model of the Fed funds rate stood at 3.65%. This is actually 70 basis points lower than the actual  level of 4.35%.

I also said that the Fed was successfully achieving a "soft landing" with employment growing at 1%. This was below the median level of employment growth  since 2004 of 1.6%.

Still , as I listened to Jay Powell Speak , I noted a sense of concern in his voice when he said that "The July employment report released earlier this month slowed to an average pace of only 35,000 average per month over the past three months, down from 168,000 per month during 2024. This slowdown is much larger than assessed just a month ago."

My interpretation of this is that Chair Powell may be concerned that the "soft landing " achieved by the Fed may be in danger of turning into a "hard landing". This suggested a rate cut of 25 basis points by the Fed at the next meeting on 17-18 September.

This would leave the Fed Funds rate at 4.1%. This would mean that the Fed Funds rate would still be 45 basis points higher than our model estimate of 3.65%. Hence the Fed Funds rate would remain "modestly restrictive."

Dire Demography?

Jackson Hole was actually a Fed Strategy meeting with many speakers in addition to Jay Powell.

Two speakers who followed on the  afternoon of his speech were Claudia Goldin, Professor at Harvard

and Chad Janis of Stanford Graduate Business School. They each gave foreboding presentations on the demography of developed economies.

Claudia Goldin spoke on "The Downside of Fertility".  She noted that birth rates in the Developed World are now generally  below replacement level. The Total Fertility rate is below 2 in France , the US and the UK.

It is dangerously low below 1.5 in Italy and Spain and below 1 in Korea. She observes that the age of first marriage of couples  in the US is now 7 years later than it was in the 1960's. This reduces  their child bearing years.

This paper was then followed by a discussion of it by Chad Janis of Stanford Graduate Business School. He noted that there is a profound difference between a future with a replacement rate of 2.2 kids per family , which he called  the "Expanding Cosmos"  with

•   Growing population leading to a growing number of researchers, leading to rising living standards  and Exponential growth in both living standards and population AND a replacement level of 1.9 kids per family which leads to  

•   Negative population growth , which he called "an Empty Planet " and the end of humanity

 as numbers of researchers declines and economic growth ceases.

Of course this seems all  very serious indeed .  Perhaps what this really means ,is that  if  we want to save the world , we should just relax and start having a lot more fun!!

Read more
Michael Knox, Chief Economist explains how the RBA sets interest rates to achieve its 2.5% inflation target, predicting a cash rate reduction to 3.35% by November when inflation is expected to reach 2.5%, based on a historical average real rate of 0.85%.

Today, we’re diving into how the Reserve Bank of Australia (RBA) sets interest rates as it nears its target of 2.5% inflation, and what happens when that target is reached. Back in 1898, Swedish economist Knut Wicksell  published *Money, Interest and Commodity Prices*, introducing the concept of the natural rate of interest. This is the real interest rate that maintains price stability. Unlike Wicksell’s time, modern central banks, including the RBA, focus on stabilising the rate of inflation rather than the price level itself.

In Australia, the RBA aims to keep inflation at 2.5%. To achieve this, it sets a real interest rate, known as the neutral rate, which can only be determined in practice by observing what rate stabilises inflation at 2.5%. Looking at data from January 2000, we see significant fluctuations in Australia’s real cash rate, but over the long term, the average real rate has been 0.85%. This suggests that the RBA can maintain its 2.5% inflation target with an average real cash rate of 0.85%. This is a valuable insight as the RBA approaches this target.

Australian Real Cash Rate -July 2025

As inflation nears 2.5%, we can estimate that the cash rate will settle at 2.5% (the inflation target) plus the long-term real rate of 0.85%, resulting in a cash rate of 3.35%. At the RBA meeting on Tuesday, 12 August, when the trimmed mean inflation rate for June had already  dropped to 2.7%, the RBA reduced the real cash rate to 0.9%, resulting in a cash rate of 3.6%.

We anticipate that when the trimmed mean inflation for September falls to 2.5%, as expected, the cash rate will adjust to 2.5% plus the long-term real rate of 0.85%, bringing it to 3.35%. The September quarter trimmed mean will be published at the end of October, just before the RBA’s November meeting. We expect the RBA to hold the cash rate steady at its September meeting, but when it meets in November, with the trimmed mean likely at 2.5%, the cash rate is projected to fall to 3.35%.

Australian Real Cash Rate - August 2025
Read more