Research notes

Stay informed with the most recent market and company research insights.

A man sitting at a table with a glass of orange juice.

Research Notes

1H24 earnings: Lace up

Accent Group
3:27pm
February 23, 2024
EBIT was 4% lower than forecast and down 11% on a pro forma basis. AX1 said it does not believe consumer demand has changed “fundamentally”, but there is a “little bit of softness” at present. AX1 has performed best where its brands are “hot” (such as HOKA). Against elevated comps, LFLs were resilient at (0.6)% in the first half and have started 2H24 at a similar pace. The comps get less demanding as the half goes on and we expect positive LFLs in 2H24 as a whole. This resilience is a function of the portfolio effect and strong market position. We have lowered our EBIT estimates by 2% in FY24 and FY25 due to higher D&A and retain an Add rating and $2.30 target price.

1H mixed- the end of “market dislocation”?

Ansell
3:27pm
February 23, 2024
1H was mixed, with an inline double-digit earnings decline, but on softer revenue and underlying profit. OPM expanded in Industrial on manufacturing efficiencies and carryover pricing, but was more than offset by contracting margins in Healthcare on continued inventory destocking and slowing of production to address inflated inventories. While a 2H recovery appears reasonable, as a proportion of earnings is driven by cost-outs/efficiencies, we remain cautious on the end of this multi-year “market dislocation” especially as gains are reliant on exogenous factors (eg supportive macros and limited customer destocking), while APIP unfolds over time. While FY24-26 estimates move lower, we roll forward valuation multiples with our DCF/SOTP PT increasing to A$22.53. Hold.

Improved cost control sees margin expansion

Wagners
3:27pm
February 23, 2024
Whilst the result was largely pre-released, the underlying 1HFY24 EBIT of $20.0m reflects a significant improvement on the $4.4m achieved in the pcp. The construction materials division was the primary driver, where EBIT increased 95% on the pcp as improved prices, volumes and cost control saw EBIT margins increase to 11.8% (1H23: 7.4%). The result really points to the cyclical nature of the industry and WGN’s leverage to an improving cycle. The positive operating environment, combined with continued M&A across the industry (ABC, BLD, CSR all receiving bids) all bode well for WGN. On this basis we have changed our recommendation to an ADD rating (previously Speculative Buy) reflecting lower earnings and valuation risk, whilst leaving our target price unchanged at $1.15/sh.

Not as clean as hoped

Medibank
3:27pm
February 22, 2024
MPL’s 1H24 underlying NPAT (A$263m) was +16% on the pcp, and -1% below company-compiled consensus (A$266m).  We saw this as a bit of a mixed result overall. Whilst the Health Insurance (HI) claims environment remains favourable, revised FY24 HI policyholder guidance and management expense growth guidance both disappointed. We make relatively nominal changes to our MPL FY24F/FY25F EPS of -1%/+2% reflecting lower claims forecasts, reduced policyholder growth expectations and higher HI operating expenses. Our PT is set at A$3.73 (previously A$3.76). The current operating environment still appears relatively favourable for MPL, but we see the stock as fair value trading on ~19x FY24F PE. HOLD maintained

No news is good news

Pilbara Minerals
3:27pm
February 22, 2024
PLS reported a soft 1H24 earnings result against consensus expectations, but given there was no significant news and the stock is highly shorted, the miss did not move the stock price greatly. 1H24 underlying EBITDA of A$415m was -8% vs Visible Alpha consensus, while underlying NPAT of A$273m was -15% vs consensus. P680 and P1000 projects are on schedule and budget. FY24 capex guidance reduce to manages costs. Maintain our Add rating with a $4.50ps Target Price. Besides the miss a quiet result for PLS. We expect the stock to re-rate in a broader lithium recovery.

Earnings supported by acquisitions and inflation

APA Group
3:27pm
February 22, 2024
We expect c.1% consensus EBITDA downgrades given first-time FY24 EBITDA guidance that at the mid-point indicates 9-10% growth over FY23. No change to DPS guidance. We layer in higher costs and capex beyond FY24. HOLD retained. 12 month target price $7./sh. At current prices, we estimate a 12 month TSR of c.-3% (incl. 6.9% cash yield) and a five year IRR of c.6% pa.

Everything, everywhere, all at once

Mineral Resources
3:27pm
February 22, 2024
Expanding vertical integration remains a key ambition, with MIN focused on increasing the proportion of controllables in its business. A solid 1H24 underlying result, although with part of the strength driven by higher-than-expected revenue across iron ore and mining services. Management revealed plans to grow Onslow to 50mtpa, and a view it might achieve as much as 12x EBITDA on the partial sell down of its haul road. We maintain an Add rating with an updated A$71ps Target Price (was A$72).

Organic growth supported by sector tailwinds

Qualitas
3:27pm
February 22, 2024
QAL has seen FUM growth of 41% (yoy), with Fee Earning FUM increasing 25% (yoy), leaving c.$2.1bn of dry powder to underpin future earnings growth. The 1H24 result saw funds management revenue increase 25% (yoy), while principal income increased 31% (yoy) off strong underwriting volumes, to deliver underlying Group NPAT of $12.6m, up 24% on the pcp, 4.6% above our expectations and 3.0% above VA consensus. QAL continues to deliver organic earnings growth of c.25% pa (based on FY24 guidance), the growth centered on a nascent residential property cycle upswing driven by unmet housing demand, along with stabilising construction prices and apartment price growth restoring development feasibilities. It is on this basis that we reiterate our ADD recommendation with a $3.10/sh price target.

Jetstar wows

Qantas Airways
3:27pm
February 22, 2024
QAN reported a better than feared 1H24 result with underlying NPBT in line with consensus but down 12.8% on the pcp. Despite this, EPS only fell 3.2% reflecting the A$1bn of shares QAN has bought back since 1H23. Jetstar’s performance was the highlight of the result. Another A$400m share buyback was announced. QAN’s outlook commentary implies consensus needs to downgrade FY24 forecasts. Importantly, travel demand remains strong. With QAN trading on 5.8x FY24F P/E, we continue to think the stock is oversold. However its is lacking catalysts in the near-term with progress on its margin targets in FY25 likely the key for share price outperformance from here, in our view.

At an inflection point

Bega Cheese
3:27pm
February 22, 2024
BGA’s 1H24 result was materially stronger than guidance following a much better than expected result from Bulk, despite it being loss making due to the material fall in global dairy prices and Australian processors overpaid for milk. Branded had a strong result. While seasonally 1H cashflow is weak, it was stronger than expected and so was BGA’s gearing metrics. Despite the result beat, FY24 guidance remains unchanged given the 1H benefited from some pull forward of sales across both businesses and in the 2H BGA is taking a conservative view on ‘out of home’ channels given the pressure the consumer is under. Albeit off a low base, we have made material upgrades to our NPAT forecast due to lower D&A and tax. After strong share price appreciation, we retain a Hold rating however we note there is material upside taking a medium-term view if BGA delivers its FY28 targets.

News & insights

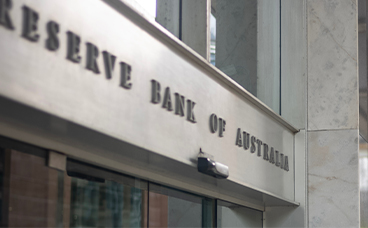
Michael Knox discusses the RBA’s decision to hold rates in September and outlines the conditions under which a November rate cut could occur, based on trimmed mean inflation data.

Just as an introduction to what I'm going to talk about in terms of Australian interest rates today, we'll talk a little bit about the trimmed mean, which is what the RBA targets. The trimmed mean was invented by the Dallas Fed and the Cleveland Fed. What it does is knock out the 8% of crazy high numbers and the 8% of crazy low numbers.

That's the trimming at both ends. So the number you get as a result of the trimmed mean is pretty much the right way of doing it. It gets you to where the prices of most things are and where inflation is. That’s important to understand what's been happening in inflation.

With that, we've seen data published for the month of July and published in the month of August, which we'll talk about in a moment. Back in our remarks on the 14th of August, we said that the RBA would not cut in September. That was at a time when the market thought there would be a September return. But we thought they would wait until November. So with the RBA leaving the cash rate unchanged on the 30th of September, is it still possible for a cut in November?

The RBA released its statement on 30th September, and that noted that recent data, while partial and volatile, suggests that inflation in the September quarter may be higher than expected at the time of the August Statement on Monetary Policy. So what are they talking about? What are they thinking about when they say that? Well, it could be that they’re thinking about the very sharp increases in electricity prices in the July and August monthly CPIs.

In the August monthly CPI, even with electricity prices rising by a stunning 24.6% for the year to August faster than the 13.6% for the year to July; the trimmed mean still fell from 2.7% in the year to July to 2.6% in the year to August. Now, a similar decline in September would take that annual inflation down to 2.4%.

The September quarter CPI will be released on the 29th of October. Should it show a trimmed mean of 2.5% or lower, then we think that the RBA should provide a rate cut in November. This would provide cheer for homeowners as we move towards the festive season. Still, it all depends on what we learn from the quarterly CPI on the 29th of October.

Read more
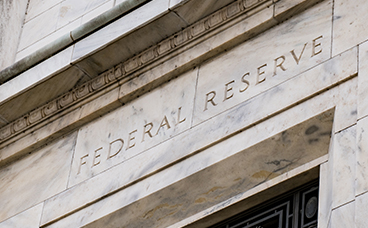
In recent days, several people have asked for my updated view on the Federal Reserve and the Fed funds rate, as well as the outlook for the Australian cash rate. I thought I’d walk through our model for the Fed funds rate and explain our approach to the RBA’s cash rate.

In recent days, several people have asked for my updated view on the Federal Reserve and the Fed funds rate, as well as the outlook for the Australian cash rate. I thought I’d walk through our model for the Fed funds rate and explain our approach to the RBA’s cash rate.

It’s fascinating to look at the history of the current tightening cycle. The Fed began from a much higher base than the RBA, and in this cycle, they reached a peak rate of 535 basis points, compared to the RBA’s peak of 435 basis points. For context, in the previous tightening cycle, the RBA reached a peak of 485 basis points.

The reason the RBA was more cautious this time around is largely due to an agreement between Treasurer Jim Chalmers and the RBA. The goal was to implement rate increases that would not undo the employment gains made in the previous cycle. As a result, the RBA was far less aggressive in its approach to rate hikes.

This divergence in peak rates is important. Because the Australian cash rate peaked lower, the total room for rate cuts and the resulting stimulus to the economy is significantly smaller than in previous cycles.

The Fed, on the other hand, peaked at 535 basis points in August last year and began cutting rates shortly after. By the end of December, they had reduced the rate to 435 basis points, where it has remained since.

Recent U.S. labour market data shows a clear slowdown. Over the past 20 years, average annual employment growth in the U.S. has been around 1.6 percent, but this fell to 1.0 percent a few months ago and dropped further to 0.9 percent in the most recent data.

This suggests that while the Fed has successfully engineered a soft landing by slowing the economy, it now risks tipping into a hard landing if rates remain unchanged.

Fed Funds Rate Model Update

Our model for the Fed funds rate is based on three key variables: inflation, unemployment, and inflation expectations. While inflation has remained relatively stable, inflation expectations have declined significantly, alongside the drop in employment growth.

As a result, our updated model now estimates the Fed funds rate should be around 338 basis points, which is 92 basis points lower than the current rate of 435. This strongly suggests we are likely to see a 25 basis point cut at the Fed’s September 17 meeting.

There are two more Fed meetings scheduled for the remainder of the year, one in October and another on December 10. However, we will need to review the minutes from the September meeting before forming a view on whether further cuts are likely.

Australian Cash Rate Outlook

Turning to the Australian cash rate, as mentioned, the peak this cycle was lower than in the past, meaning the stimulatory effect of rate cuts is more limited.

We have already seen three rate cuts, and the key question now is whether there will be another at the RBA’s 4 November meeting.

This decision hinges entirely on the September quarter inflation data, which will be released on 29 October 2025.

The RBA’s strategy is guided by the concept of the real interest rate. Over the past 20 years, the average real rate has been around 0.85 percent. Assuming the RBA reaches its 2.5 percent inflation target, this implies a terminal cash rate of around 335 basis points. Once that level is reached, we expect it will mark the final rate cut of this cycle, unless inflation falls significantly further.

So, will we see a rate cut in November?

It all depends on the trimmed mean inflation figure for the September quarter. If it comes in at 2.5 percent or lower, we expect a rate cut. The June quarter trimmed mean was 2.7 percent, and the monthly July figure was 2.8 percent. If the September figure remains the same or rises, there will be no cut. Only a drop to 2.5 percent or below will trigger another move.

We will have a much clearer picture just a few days before Melbourne Cup Day.

Read more
The Wall Street Journal of 21 August 2025 carried an article which noted that Ether, a cryptocurrency long overshadowed by Bitcoin has surged in price in August

The Wall Street  Journal of 21 August 2025 carried an article which noted that Ether, a cryptocurrency long overshadowed by Bitcoin has surged in price in August.

The article noted that unlike Bitcoin, there was not a hard cap on Ether supply, but the digital token is increasingly used for transactions on Ethereum , a platform where developers build and operate applications that can be used to trade, lend and borrow digital currencies.

This is important  because of the passage on 18 July 2025 of the GENIUS act which creates the first regulatory framework for Stablecoins. Stablecoins are US Dollar pegged digital tokens. The Act requires  that  Stablecoins , are to be to be fully  backed by US Treasury Instruments  or other  US dollar assets .

The idea is that if Ethereum becomes part of the infrastructure of Stablecoins , Ether would then benefit from increased activity on the Ethereum platform.

Tokenized money market funds from Blackrock and other institutions already operate on the Ethereum network.

The Wall Street journal  article  goes on to note that activity on the Ethereum platform has already amounted to more than $US1.2  trillion this year ,compared with $960 million to the same period last year.

So today ,we thought it might be a good idea to try and work out what makes Bitcoin and Ether  go up and down.

As Nobel Prize winning economist  Paul Krugman once said "  Economists don't care if a Model works in practice ,as long as it works in theory" .  Our theoretical model might be thought as a "Margin Lending Model" . In such a model variations in Bitcoin are a function of variation in the value of the US stock market .

As the US stock market rises, then the amount of cash at margin available to buy Bitcoin also rises .

The reverse occurs when the US stock market goes down .

Our model of Bitcoin based on this theory is shown in Figure 1  .  We are surprised that this simple model explains 88% of monthly variation  in Bitcoin since the beginning of 2019.

Figure 1 - BTC

At the end of August  our model  told us that when Bitcoin was then valued at $US112,491 , that it was then overvalued by $US15,785 per token.

Modeling Ether is not so simple . Ether is a token but Ethereum is a business.  this makes the price of Either sensitive to variations in conditions in the US Corporate Debt Market.

Taking that into account as well as stock market strength, gives us a model for Ether which is shown in figure 2.


Figure 2- Ethereum


This model explains 70.1% of monthly variation since the beginning of 2019. Our model tells us that at the end of August, Ether at $US 4,378per token was $US 560 above our model estimate of $US3,818.00 . Ether is moderately overvalued.

So neither  Bitcoin nor Ether are cheap right now.

ETFs for each of Bitcoin and Ether are now available from your friendly local stockbroker .

But right now , our models tell us that neither of them is cheap!

Read more