Five key takeaways
- Renters, investors and owners all want the same thing, affordable housing. Renters want a place where they can live, while they save; investors want a place, they can trust, to invest their savings; and owners want to use their savings to buy a place they can call their own. They all want affordable housing.
- Affordability is price relative to household disposable income. You can improve housing affordability by either (1) reducing prices, which hurts all existing homeowners, and discourages investment in new housing supply or (2) increasing productivity which will improve everyone’s disposable income and housing affordability.
- Every renter is renting an existing home from an investor; and every renter now faces the prospect, that when their investor needs to sell, there will be higher taxes on any future investor, who could help them stay in their exiting home. (Note there are 100,000 to 200,000 investors selling every year).
- It is estimated, that the changes to negative gearing, for existing, residential, rental accommodation will (1) reduce the supply of existing residential rental accommodation by around 110,000 homes and (2) raise around $30billion in additional taxes, over the decade. (Note there have been no changes to negative gearing for any other business or investment purpose, only for residential rental accommodation)
- Australia’s 3 levels of Government currently collect, in fees, charges and taxes over $1trillion a year, and it takes 10million Australians earning $100,000 a year to pay $1trillion in fees, charges and taxes.
I wanted to share some thoughts on housing, taxation and productivity; and I wanted to start by framing the conversation in the following terms.
We are a family society, not a collection of individuals.
We are not an individualistic society; we are a family society. Families are the single biggest source of self-sacrifice. Parents consistently value the consumption of their children higher than their own, and children consistently strive for the freedom to contribute something of value to their family.
We are all workers, investors and consumers.
Unfortunately, public policy is frequently framed around the individual; the ‘worker’, the ‘renter’, the ‘investor’, the ‘consumer’, as though they were different people, with competing interests. When in reality, we are all workers, investors and consumers; we are the same person, the same family. Maybe at different stages of our lives, or just different hours of the day, but we are the same person, and we can’t be broken down into pieces. When you tax one part of me, you tax all of me, and if not me, then my family.
Renters need investors to invest; to increase the supply of rental accommodation in the towns and suburbs where renters want to live and work.
Today, every renter is renting an existing home, not waiting for one to be built. Every renter is renting off an investor, and typically because they cannot afford to buy. The investor is financing the renter’s accommodation, the renter’s home, and chances are the investor is losing money; that is, they are negatively geared (or would be negatively geared if they were buying in today’s property market).
An investor is just a worker with a second job.
How can an investor afford to be negatively geared? Well because the investor is a worker. Up until budget night, when a worker used their wages to cover the costs of supplying rental accommodation, those costs were tax deductible, but not anymore. Every renter now faces the prospect, that when their investor needs to sell (and 100,000 to 200,000 investors need to sell each year), the Government will impose higher taxes on any future investor, who could help them stay in their existing home; and Australia has over 3 million rental homes.
What Treasury’s own numbers say.
In fact, the Federal Treasury’s, budget night information paper, estimates that over the next decade, under the new taxes;
- Home ownership will increase by 75,000 (over a decade), while thei
- Supply of new homes will be reduced by around 35,000, so there will beii
- a net reduction of 110,000 rental properties, and
- the Government collects, an additional, $30billion in taxes.iii
Is it worth it, when only 1% to 2% of Australia’s 3 million rental properties (i.e. 30,000 to 60,000 homes) are currently vacant and available for rent?
Productivity, not bureaucracy, improves affordability.
Unfortunately for homebuyers and renters, Australia’s residential construction industry is suffering from stagflation. That is prices are rising without a corresponding increase in supply. For most goods and services, if you increase prices, you will increase supply.
Fifty years on, and we are still building 100,000 houses a year.
In the 1970’s Australia was building around 100,000 houses a year and we continued to build 100,000 houses a year in the 1980’s and the 1990’s and the 2000’s and in fact, today we are still building around 100,000 houses a year. We are building more units, but the peak supply of houses plus units in the 1970’s was around 150,000 and the peak in 2018 was around 210,000, an increase of less than 1% p.a. over 40 years.iv While the average property price in Brisbane has increased by close to 10% p.a., in no small part, because the government fees charges and taxes, on new residential construction, have increased by 15% p.a., compounding for 40 years. Government charges have increased from 10% of the construction cost in the 1970’s to closer to 40% of total constructions costs today.v
Builders build houses. Public policy does not.
Public policy does not build houses, builders build houses and when input costs are rising faster than sale proceeds, they cannot afford to build more houses, they simply go out of business. Developers, banks, investors and home buyers deliver the housing supply and carry the risks.
Real incomes only rise with productivity.
Housing affordability is a measure of prices relative to household disposable income, and the only way for realvi disposable incomes to sustainably increase is with productivity. With productivity of 2%p.a. you will double your real disposable income in 35yrs, at 1%p.a. you will double your real disposable income in 70yrs and with negative (-) 1%p.a. you will halve your real disposable income in 70yrs.
Over the last 5yrs, Australia’s private sector productivity has been struggling to reach 2%p.a. (doing more with less), while the public sector has been edging towards negative (-) 1%p.a. (doing less with more). In other words, every dollar of capital that stays in the private sector and isn’t taxed away to the public sector is 3%p.a. more productivevii, doubling in 23yrs.
The miracle of compounding productivity
Government taxes, $1trillion p.a. and rising. Government debt, $1trillion and rising.
Over the last 5yrs, (from the 2019/20 budget year to the 2024/25 budget year) the average annual increase in taxes and public sector debt, across Australia’s three levels of government, has been $130billion per year.
- Taxes, fees and charges have increased from $680billion (2019/20) to over $1trillion (2025/26), and on track to double in 9yrs; and
- Net Debt (all levels of government combined) has increased from $630billion (2019/20) to just under $1trillionviii (2026) and on track to double in less than 8yrs.
What $1 trillion actually looks like.
To put $1trillion into perspective, there are 12million Australian’s working in the private sector, and it takes 10million Australians, earning $100,000 a year, to generate $1trillion in wages. In other words, the current annual taxes, fees and charges of Australia’s three levels of government, is equivalent to the entire income earned by 10million Australians, with wages of $100,000 a year.
Spend less, tax less, and lift public sector productivity.
Taxpayers (that is workers, employers, investors and consumers; probably the same person or family) need to reduce their spending on the public sector (Government services) and spend more on the private sector, if we are to arrest the decline in Australia’s living standards, improve housing affordability and be able to save enough for our retirement.
In other words; Politicians needs to spend less, tax less and improve public sector productivity.
What this means for you and your family.
I have used this letter to talk about renters, and the investors they rely on for their family homes; but there have been several other significant changes enacted or proposed to be enacted, as part of this year’s Federal Government budget. So please reach out if you have any questions about your own strategy, and what you and your family can be doing to invest in a stronger, more resilient future.
In summary
We are not competing interest groups. We are workers, investors and consumers all at the same time, we are the same person, and part of the same family. Renters depend on investors, investors depend on wages, and every one of us, depend on productivity for our lifestyle and living standard.
Taxing the supplier of rental housing does not create rental housing. Public policy does not build homes; builders, developers, banks, investors and home buyers build homes, and they carry the risk. If we want affordability to improve, we need the private sector to be more productive and government to spend less, tax less and do more with what it already takes.
That is the long-run argument. The short-run question is a personal one: what do these changes mean for your family’s strategy? That is a conversation I am always happy to have.
Regards,
Ken Howard CFA LLB B.Econ
Authorised Representative 259290, Morgans
P.S. as part of my long-term business plan, I will be working more closely with a number of developing advisers and as a consequence will be looking to grow my client base; so if you know a friend or colleague who is looking for retirement and investment advice please pass on my details.
i Budget Paper 2026-27: tax-explainers-negative-gearing-capital-gains-tax.pdf
ii ABC: budget-2026-government-breaks-promise-negative-gearing-capital gains tax
iii CBA: 2026-27 Federal Budget: Big ambitions, mixed results, PBO (Public Budget Office) Phase out negative gearing and CGT tax concessions for property investors with more than one investment property, and PBO Cost of Negative Gearing and Capital Gains Tax Discount
iv Reserve Bank of Australia: Housing Construction Productivity: Can We Fix It?
v Housing Industry Association: red-tape-impairing-productivity-gains
vi If wages are increasing at 4%p.a. and inflation is 4%p.a. there is no ‘real’ increase in wages, they are just keeping up with inflation. ‘Real’ increases come from productivity not inflation.
vii Productivity Commission: quarterly-productivity-insights
viii Australian Bureau of Statistics: government-finance-statistics-annual
A few questions I have been asked since budget night
These are some of the more common questions since Budget night.
1. Aren’t investors just competing with first home buyers?
At the margin, yes, but the two groups are not trying to do the same thing. An investor is buying a home that they can rent and will hopefully grow in value over time; a first home buyer, is buying a place that they want to live in and call their own. These are often very different properties in very different locations, but even if they are not, society needs both homes for renters and homes for owner occupiers. Treasury’s own estimate is that home ownership rises by 75,000 over a decade while new supply falls by around 35,000, a net reduction of 110,000 rental homes. With only 1–2% of Australia’s 3 million rental properties vacant and available today, the renters left behind are the ones who will bear the cost.
2. If negative gearing costs the Government money, isn’t removing it a saving?
Deductibility is not a subsidy; it is the ordinary tax treatment of a cost incurred in earning income, which is available to every business in the country. What the change actually does do, is it will raise around $30 billion of additional taxes over a decade from the people who supply rental housing. That cost will be borne by renters with higher rents, investors with lower returns and by society with lower supply.
3. Won’t house prices fall, which helps affordability?
Affordability is prices relative to household disposable income, so it can improve in two ways: prices fall, or real incomes rise. Falling prices damage the equity of the millions of Australians who already own a home and reduce the willingness of developers and banks to fund new supply. Rising real incomes damages nobody, but it will require productivity, which is exactly what the last decade has been short of.
4. Why hasn’t supply responded, given how high prices are?
Because the builder’s margin, not the sale price, decides whether a project proceeds. Government fees, charges and taxes on new residential construction have grown around 15% p.a. for 40 years, from roughly 10% of construction cost to closer to 40%. When input costs rise faster than sale proceeds, builders do not build more, they build less, or they go out of business.
5. Is the public sector really less-productive, or is that just an assumption?
Over the last five years, private sector productivity has struggled to reach 2% p.a., while public sector productivity has edged towards (–)1% p.a., as measured by the Federal Government’s, Productivity Commission.
The practical consequence is that every dollar that stays in the private sector is compounding roughly 3% p.a. faster, than a dollar taxed away to the public sector. As a consequence: lowering taxes will be the fastest way to improve productivity.
I would note that the measure does not compare the public sector with the private sector, it compares what the public sector did last year, with what it is doing this year; in other words, the public sector is 1% less productive this year versus last year, and last year was 1% less productive than the year before etc. In other words, the public sector is producing less with more. It hasn’t always been this way, and it doesn’t have to stay this way. Pre-Covid the public sector actually recorded positive productivity, between 2016 and 2020. Public sector productivity has only really deteriorated in the last 5yrs.
Appendix 1: Figure 1.1: Australia’s housing supply since 1955
Where it comes from
This is Figure 1.1 from the Productivity Commission research paper: ‘Housing construction productivity: Can we fix it?’ (page 10), reproduced with its original title, notes and source. It is the same Productivity Commission work referenced in endnote iv of this letter.
What it is telling you
- Left panel: total dwelling completions, each year, since 1955; split between detached houses (light blue) and higher-density dwellings (dark blue). The two dashed grey lines are the National Housing Accord target of 240,000 homes a year and the average of the last ten years, about 192,000.
- The detached-house layer has been almost flat for 70 years. Essentially all of the growth has come from apartments and townhouses.
- Right panel: additional dwellings for every additional 1,000 people living in Australia. This is the sharper measure: we are building fewer homes than we were at almost any time between the 1970s and the 2000s, for every 1,000 people, born in and / or who migrate to, Australia.
- Together the two panels make the point in the letter. Prices have risen roughly 10% a year while volumes have barely moved. Supply is not responding to price, which is what tells you the constraint is on the cost and approval side, not on the demand side.
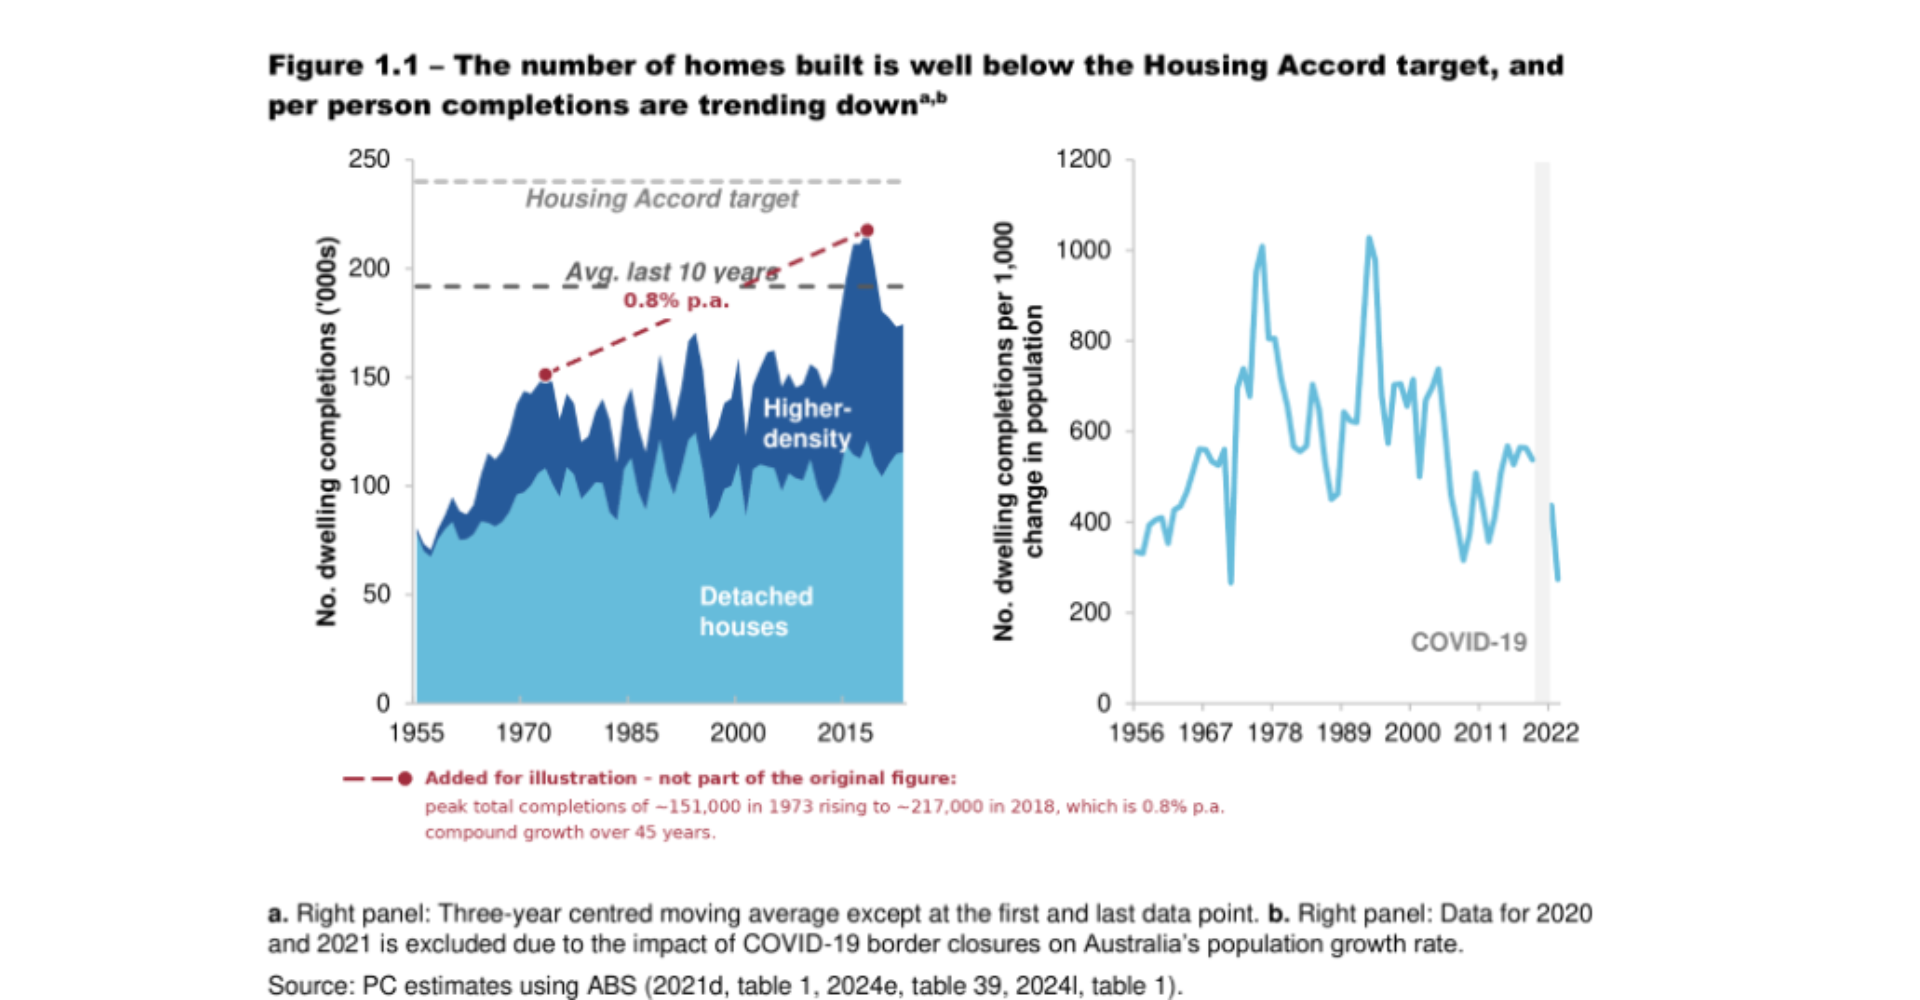
I have added the dashed red line:
The dashed red line is not part of the Productivity Commission’s original chart. It simply joins the peak year of total completions in the 1970s (about 151,000 homes in 1973) to the peak year in the 2010s (about 217,000 homes in 2018). Across those 45 years that is compound growth of 0.8% a year, less than 1% p.a. Over the same period Australia’s population roughly doubled.
Peak and trough values are read from the published figure, so they are approximate to the nearest thousand
Appendix 2: New homes are highly taxed and regulated
Where it comes from
The following is reproduced from the Housing Industry Association’s submission to the Productivity Commission’s Housing Construction Productivity report, October 2024, page 9. It is the HIA source referenced in endnote v of this letter. The text and chart are theirs; the commentary that follows is mine.
New homes are highly taxed and regulated
The ABS stated in its methodology for KLEMS Productivity in 2015 that: “Multifactor productivity in this industry needs to be interpreted with consideration to regulated building standards and taxation frameworks (ABS, 2015).” Home building in Australia is highly regulated and taxed. Minimum building standards are set by the Australian Building Codes Board (ABCB) through the National Construction Code (NCC). Housing is taxed by governments of all levels but particularly at a state and local council level.
Whether it is through stamp duty, land taxes or development levies, a series of cascading taxes are imposed on new homes. This does not include the ‘pseudo-taxes’ of increasing regulatory costs, such as through changes mandated by the NCC and local planning systems. HIA engaged with the Centre for International Economics (CIE) to produce a bottom-up research report which details the tax imposts on new homes across different capital cities. It found that as much as 50 per cent of a new ‘house and land’ package in Greater Sydney are made up of taxes, fees and excessive charges imposed by governments (CIE, 2019).
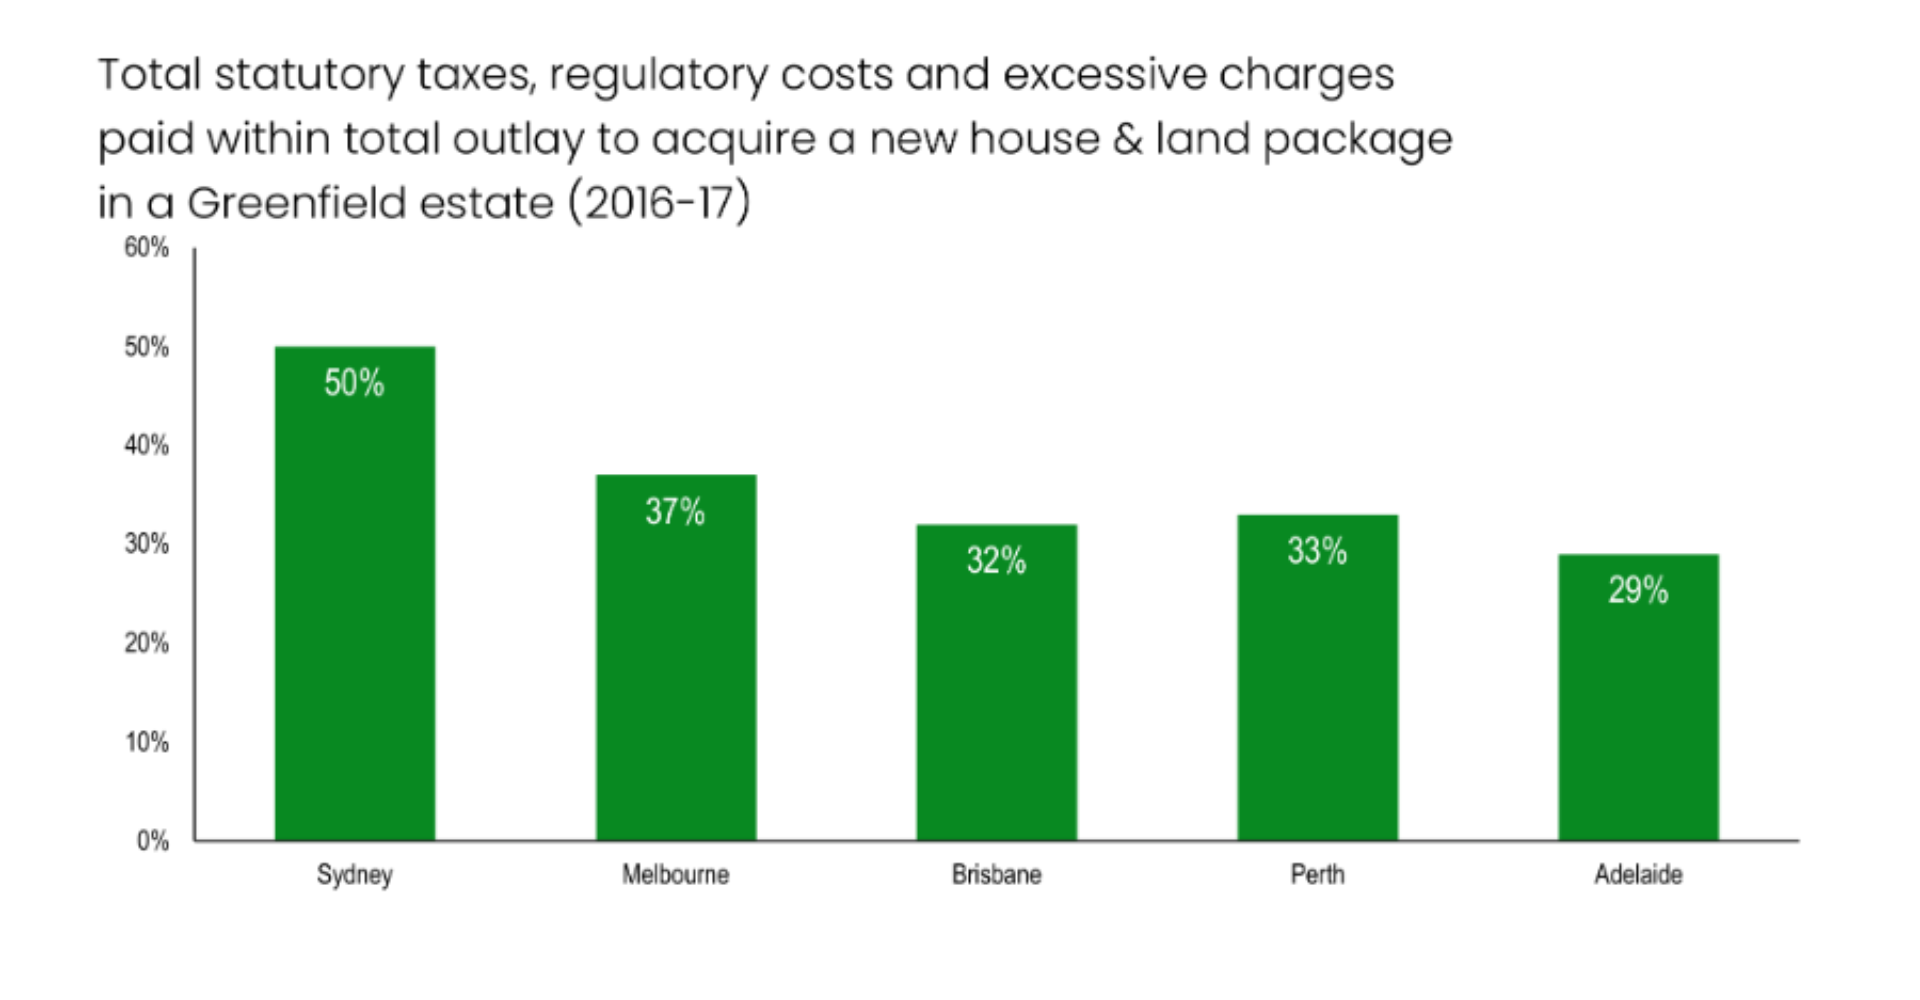
Reproduced from HIA Submission to PC Housing Construction Productivity Report, October 2024, p. 9, using CIE (2019) estimates. The only change is the removal of two stray legend captions from the original, which described a second data series that does not appear in the chart. No data has been altered.
Housing is one of the most heavily taxed goods in the economy, just after the sin taxed products of tobacco and alcohol. Land taxes, rates, taxes on immovable property and stamp duty contribute around $51 billion annually in revenue to state and local governments. Housing accounts for 11 per cent of economy-wide GVA but provides 14 per cent of total GST revenue. National Accounts data indicate that ownership transfer costs, which includes real estate and legal fees, stamp duties and government transfer charges, were valued at $40.1 billion in 2023/24. Ownership transfer costs accounted for almost two per cent of real gross domestic product (GDP) in 2023/24.
To which I would add
- Brisbane sits at 32%, and that is the conservative reading. The CIE figure measures taxes, fees and charges against the total outlay for a house-and-land package, which includes the land itself. The 40% figure quoted earlier in this letter is measured against construction cost alone, a smaller base, which is why it is the larger number. The two are consistent, not contradictory — they are simply answering different questions. The CIE data is also 2016-17, so it predates almost a decade of further increases.
- “Cascading” is the operative word. Stamp duty, land tax, development levies, GST and council charges are applied at different points to the same underlying transaction. This is the letter’s framing made literal: it is not four different taxes on four different people, it is a sequence of taxes on one house, ultimately paid by one family.
- New housing is taxed like a vice. Sitting behind only tobacco and alcohol is a striking position for a good that every government in the country says it wants more of. We tax cigarettes heavily because we want fewer of them. We should not be surprised when the same approach to new homes produces the flat supply line in Appendix 1.
- It connects housing directly to the $1 trillion. Property taxes contribute about $51 billion a year to state and local governments, and housing supplies 14% of GST revenue while producing only 11% of economy-wide value added. Housing is not incidental to the government revenue figures set out earlier in this letter, it is one of the pillars holding them up, which is precisely why reform is politically difficult.
- $40.1 billion of pure transaction friction. Ownership transfer costs are close to 2% of real GDP and they build nothing. They are a direct tax on moving, on downsizing, on relocating for a better job, on a growing family upsizing. Every one of those decisions is a productivity decision, which ties this appendix straight back to the productivity argument: part of the shortfall is not a failure to work harder, it is a toll on rearranging ourselves efficiently.
- The ABS itself says productivity here cannot be read at face value. The KLEMS caveat quoted at the top is the strongest support for the letter’s central claim. When the national statistician warns that measured productivity in home building must be interpreted alongside building standards and taxation, it is confirming that the regulatory and tax burden is not a side issue in construction productivity. It is part of the measurement.
One note on the source: the HIA is an industry body and the CIE report was commissioned by it, so the figures should be read as an industry estimate rather than an official statistic. That said, the submission was made to the Productivity Commission and the underlying data is public, so it is a reasonable and defensible reference.
Appendix 3: What the ABS data actually says
Charts built from ABS Government Finance Statistics, Annual, the same source cited in endnote viii. All figures are, all levels of government combined, general government sector, current prices.
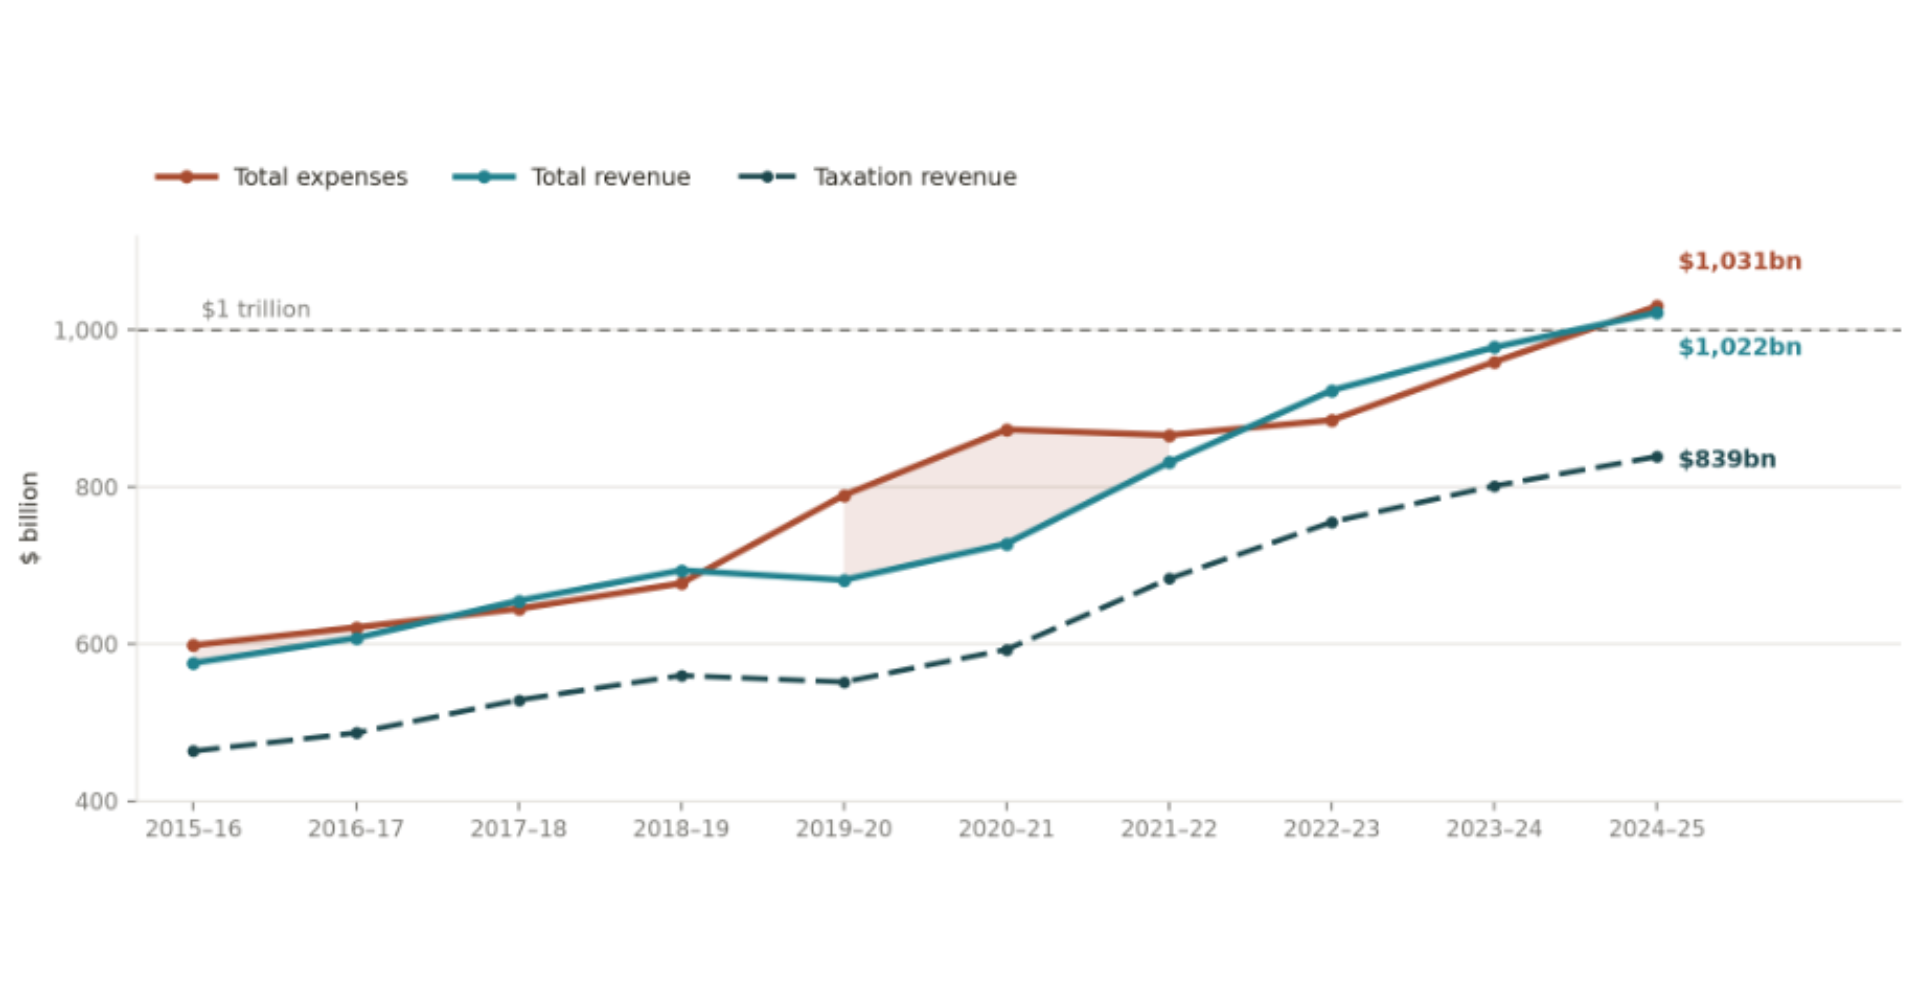
Chart 1 Total revenue, total expenses and taxation revenue, all levels of government, 2015-16 to 2024-25. Shaded area shows expenses exceeding revenue. Source: ABS GFS Annual 2024-25, Table 939 and Key Tables 6.
The letter’s numbers hold up
- “$680 billion to over $1 trillion” is exactly right. Total revenue was $681.7bn in 2019-20 and $1,022.4bn in 2024-25. It crossed a trillion dollars for the first time in 2024-25.
- Taxation revenue alone rose 52% over the same five years, from $551.8bn in 2019-20 to $839.0bn in 2024-25, an increase of $287bn. Across the full decade in Chart 1 it is up 81%.
- Net debt rose $317bn in five years. All levels of government combined, net debt was $637.9bn at 30 June 2020 and $954.9bn at 30 June 2025, an average increase of $63.4bn every year.
- The $130 billion a year is almost exact. Revenue growth averaged $68.1bn a year and net debt growth $63.4bn a year over the five years from 2019-20. Combined, that is $131.5bn a year, both figures measured from the same base year and drawn from the same ABS release.
- Record revenue, and still a deficit. Expenses of $1,030.5bn exceeded revenue of $1,022.4bn in 2024-25, a net operating balance of (–)$8.2bn after two years in surplus. This is the strongest single argument for the letter’s “spend less” conclusion: revenue is at an all-time high and it is still not enough.
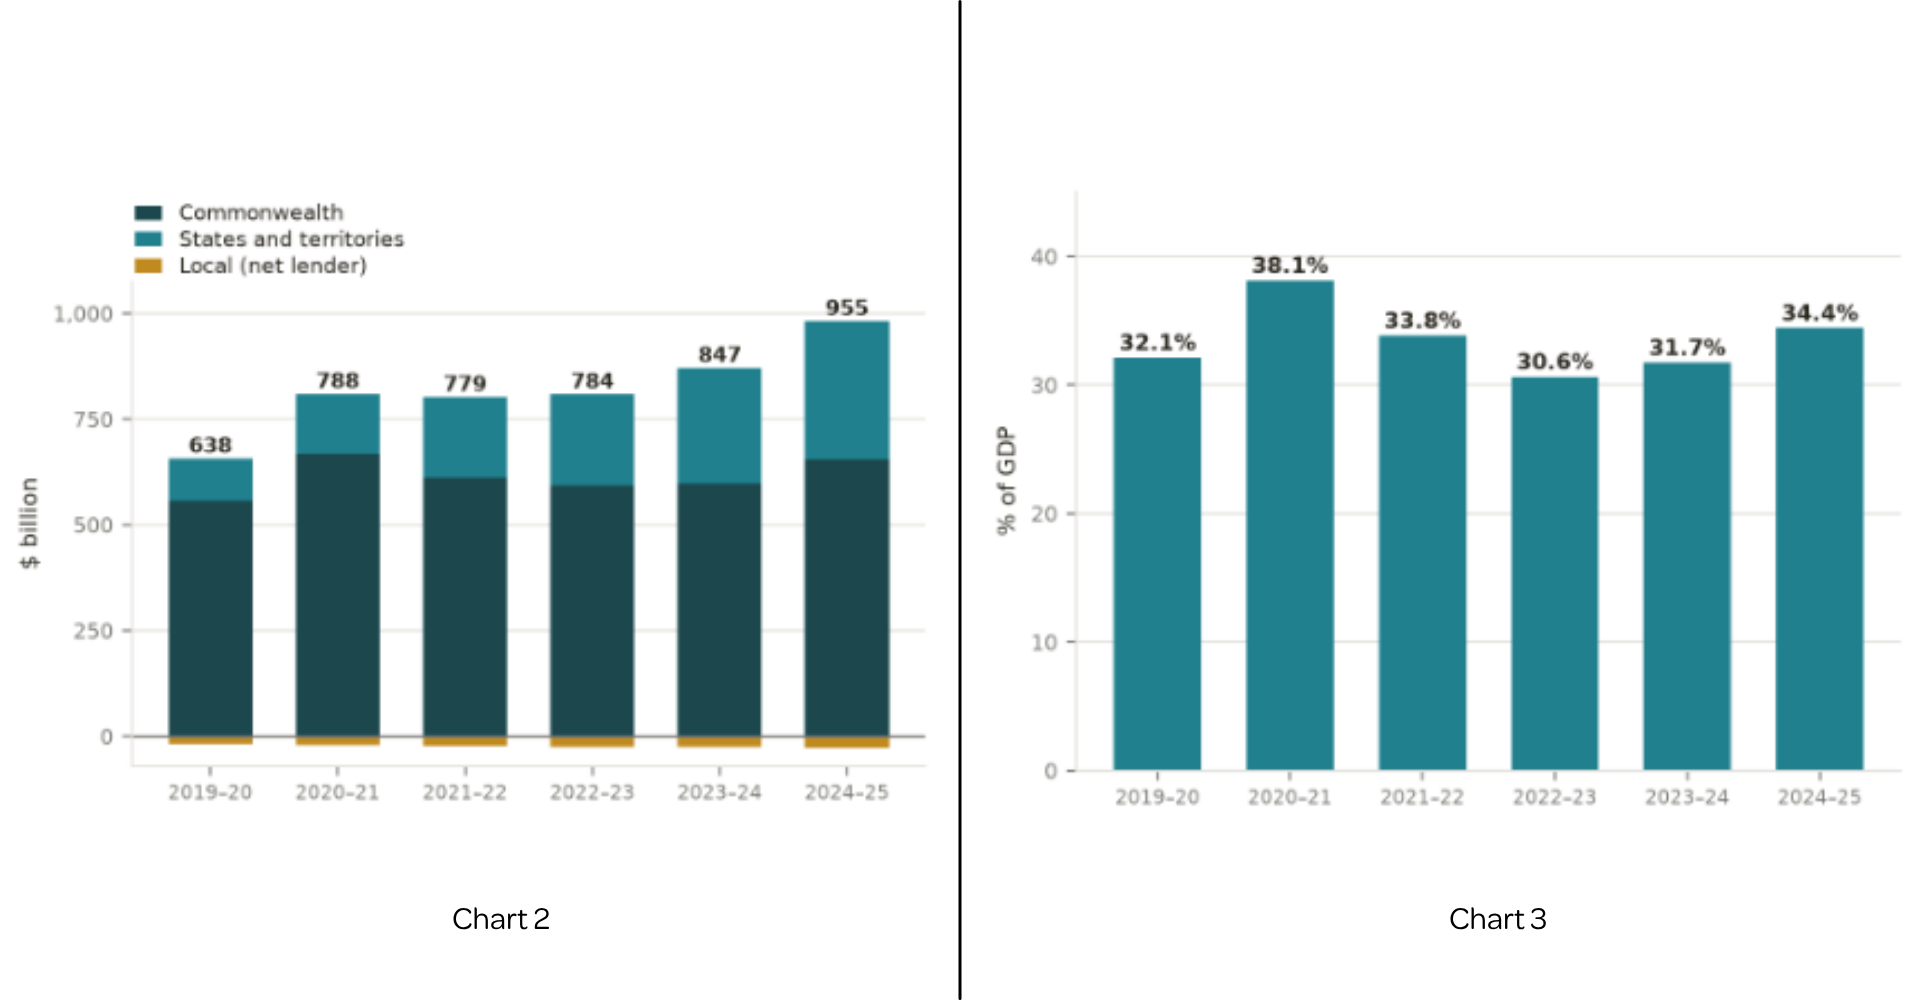
Source: ABS GFS Annual, Key Tables 15 and 16, 2020-21 to 2024-25 releases; 2019-20 from the net debt section of the ABS GFS Annual 2019-20 release.
What the data adds that the letter does not yet say
- Almost three quarters of the increase is state debt. Since 30 June 2020, Commonwealth net debt has risen 18%, from $555.6bn to $654.1bn, and it is still below its 2020-21 peak of $667.5bn. State and territory net debt has more than tripled over the same period, from $101.3bn to $328.1bn and of the $226.8bn increase $116bn has come from Victoria. States levy stamp duty, land tax and development charges, so the governments with the strongest fiscal incentive to keep taxing property, are the ones whose balance sheets are deteriorating the fastest.
- The fall in the debt ratio was inflation, not repayment. Net debt dropped from 38.1% of GDP to 30.6% between 2020-21 and 2022-23 while the dollar figure barely moved, $788bn to $784bn. Nominal GDP did the work. It has since climbed back to 34.4%, which is above the 32.1% it stood at before the pandemic. Anyone claiming debt has been brought under control is quoting the ratio during the inflation spike.
- On the broader measure, the trillion has already gone. General government net debt of $954.9bn supports “just under $1 trillion”. But total public sector net debt, which includes government business enterprises, has gone from $778.5bn as at 30 June 2020 to $1,162.8bn as at 30 June 2025, an increase of 49% in five years, and already well past the trillion.
All figures are current prices, original series, all levels of government combined. Net debt is the ABS L2 measure, which the ABS states is comparable to government reporting of net debt under Australian accounting standards.
Appendix 4: Where the $30 billion comes from
The Budget papers do not contain a $30 billion figure. Budget Paper No. 1, Statement 4 says only that the reforms are “expected to raise $3.6 billion in receipts over the forward estimates period” — nil in 2026-27 and 2027-28, $1,350m in 2028-29 and $2,280m in 2029-30. The decade number is an extrapolation of that profile. The Parliamentary Budget Office is the only public body to have published documented ten-year numbers, and everything below is its negative gearing line alone.
The two PBO documents
- ECR-2025-3414 costs the removal of negative gearing for all assets except the first investment property acquired before the start date. Its negative gearing line raises $90m in year one, $6.44bn over the forward estimates and $38.1bn over the ten years to 2035-36, by which point it is running at $6.39bn a year.
- Cost of Negative Gearing and Capital Gains Tax Discount (17 April 2025) measures the existing concession rather than a change to it. Negative gearing deductions cost $7.4bn of revenue forgone in 2025-26, rising to $14.1bn in 2035-36 — $108.0bn over the decade from 2026-27.
How the number is built
- It is heavily back-loaded. The PBO’s negative gearing line runs from $90m in the first year to $6.39bn in the eleventh, averaging about $3.5bn a year, and the decade total is roughly six times the forward-estimates total. Treasury’s $3.6bn covers four years of which only two are material, and the announced package starts two years later than the PBO’s. On that ramp a decade figure near $30 billion is a conservative reading, not an inflated one.
- The concession is growing fast on its own. Negative gearing deductions cost $2.1bn in 2021-22 and $7.4bn in 2025-26 — more than a tripling in four years as interest rates rose. That is why the forgone revenue keeps compounding out to $14.1bn a year.
- The base is narrow. The top income decile takes 40% of the negative gearing benefit — $2.95bn of the $7.4bn in 2025-26 — and the top two deciles take 56%. The revenue is drawn from a small and highly mobile group.
The assumptions behind it
- Behaviour: a taxable income elasticity of 0.2 for affected investors; the ratio of rental taxpayers in profit to those in loss falling to 0.65 by 2035-36; and around 7% of the existing investment property stock sold each year.
- Coverage: companies, partnerships and trusts are excluded from both documents for lack of data, and every negative gearing deduction is assumed to be residential because the data cannot separate it from commercial.
- Timing and settings: 5% of the tax effect lands in-year, 90% the following year and 5% the year after. Inputs are ATO returns and rental schedules as at 2022-23, with tax rates frozen at 2025-26 Budget settings.
- The PBO’s own caveat: projections for “rental incomes, interest rates and asset prices … are highly volatile across years and relatively small changes can significantly change the financial implications.” It also states that the negative gearing change “may reduce the return on investment for landlords making it less likely for them to invest given current house prices and rents”, with a flow-on to house prices. That is the letter’s argument in the PBO’s own words.
Sources: PBO, ECR-2025-3414 (2025 Election Commitments Report), and PBO, Cost of Negative Gearing and Capital Gains Tax Discount, 17 April 2025 — both at pbo.gov.au, Tables A1 and A3. Figures quoted are the negative gearing components only. Forward estimates from Budget Paper No. 1, Statement 4, 2026-27 Budget.