In their book "A Monetary History of the United States", published in 1963, Economists Milton Friedman and Anna Schwartz provide, amongst other things, a description of the Liquidity Crisis that precipitated the Stockmarket Crash and the Credit Crunch of the 1930's. In doing so, they create a measure of Credit Liquidity in the US equities market.
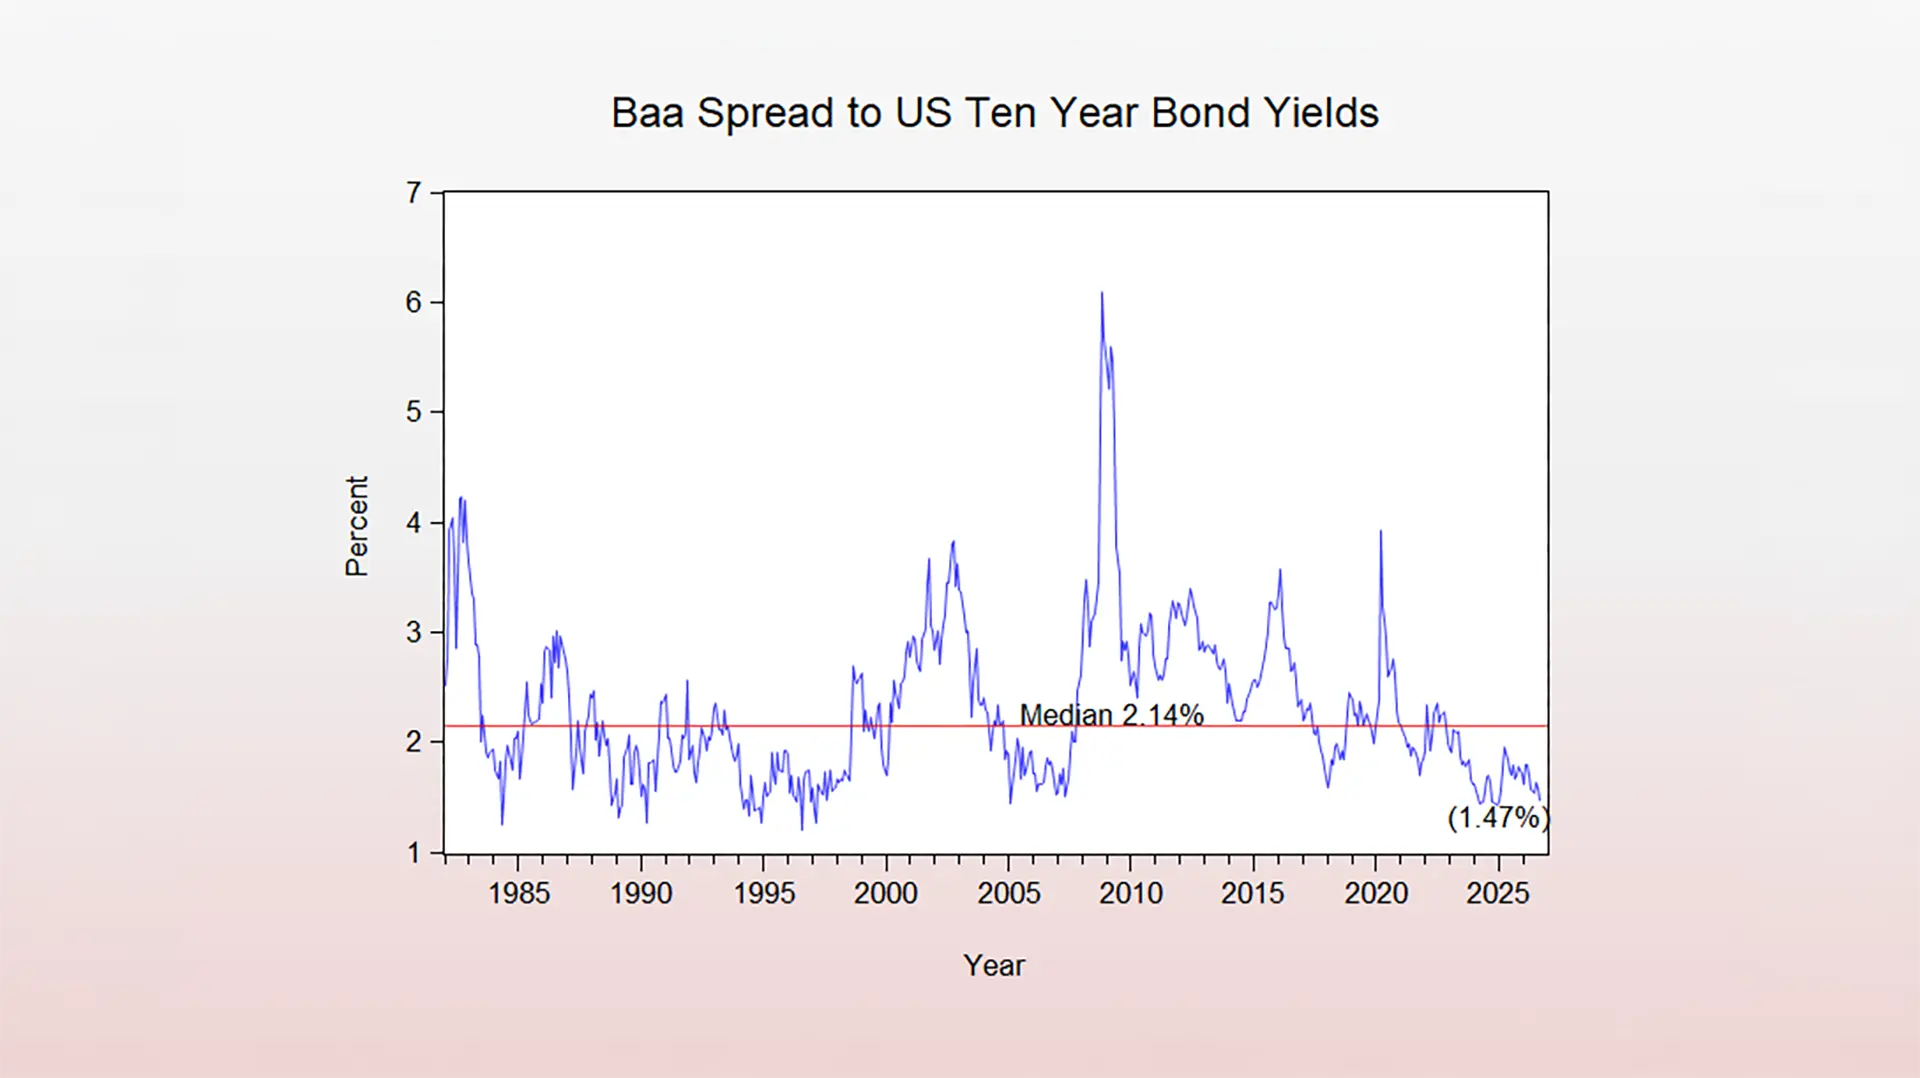
They show this measure as the difference between US Ten Year Bond yields and the Yields on US investment grade Corporate Debt with the Moody's rating Baa.
The Federal Reserve update the calculation of this series daily on the publicly available Federal Reserve Database. The Median Level of this spread since 1982 is 2.14%.
The level of this spread on 18 September 2026 was 1.4%. This would appear to be amongst the lowest levels of this spread seen during this century. This means that the level of liquidity in the US equities market is amongst the highest this century.
Compare this to the measure this century of 6.1% recorded in November 2008 during the Financial Crisis or Credit Crunch. That tightness of liquidity precipitated the stockmarket collapse of that period.
We will refer to this measure simply as the Baa spread.
We construct a simple model of the Australian equities market, the ASX200, to test the effect of the following variables: the S&P500, The Baa spread, Australian Company earnings and Australian Ten year bond yield.
These yield individual T statistics of SP500 of 15.2; Baa Spread 6.6; Australian Earnings 3.5 and Australian Ten year bond yield 1.8.
Surprisingly, the effect of liquidity in the US equities market appears to have a higher influence on Australian equities than Australian Earnings and Australian bond yields.
Want to discuss how this impacts your portfolio?
DISCLAIMER: Information is of a general nature only. Before making any financial decisions, you should consult with an experienced professional to obtain advice specific to your circumstances.

.jpg)
.jpg)