Key Takeaways:
- The Australian economy is recovering within a positive international outlook, with growth improving into 2026.
- Inflation has rebounded, largely driven by electricity prices and the withdrawal of government subsidies.
- Diverging interest rate paths between Australia and the United States point to a stronger Australian dollar.
- Commodity prices and Australian cyclical stocks are expected to recover after a seasonal market correction.
What challenges and opportunities does the Australian economy face?
The Australian economy, challenge and opportunity
Today we want to talk about the unusual group of challenges which the Australian economy now faces. We will then move on to look at some remarkable opportunities.
How is the US economy expected to perform into 2026?
Last year 2024, the US economy grew by 2.2%. We think it will grow in 2025 by 1.8%. This modest slowing of growth is occurring as the Fed Reserve achieves a soft landing in the US economy.
We expect that the Fed Reserve having achieved that soft landing, will undertake a series of rate cuts, with the first beginning in the meeting of 10 December this year. We expect a single rate cut of 25 basis points of that meeting with a further 25 basis points at the next meeting in the new year. This will bring down the Fed Funds rate to our estimate of neutral.
The Fed might reasonably be expected to cut rates further to provide a genuine stimulus for recovery in the US economy later in the year. We expect that after growth of 1.8% in 2025, growth should accelerate to 2.2% in 2026.
What is the growth outlook for the Australian economy?
Australia is in an international environment where growth in 2026 is expected to be better than growth in 2025. The Australian economy is recovering within this positive international outlook. After 1.3% growth in 2024, we expect the Australian economy to grow by 2.1% in 2025. This should then be followed by an improvement in growth to 2.3% in 2026.
Why is inflation rebounding in Australia?
The problem Australia has, in the short term, is a rebound in inflation. After 2.4% inflation in 2024, it is likely that CPI headline inflation will reach 3.8% in 2025. Indeed it already reached this number for the year to October 2025. Depending on government action, we think inflation might ease to a headline level in 2026 of 3.0%.
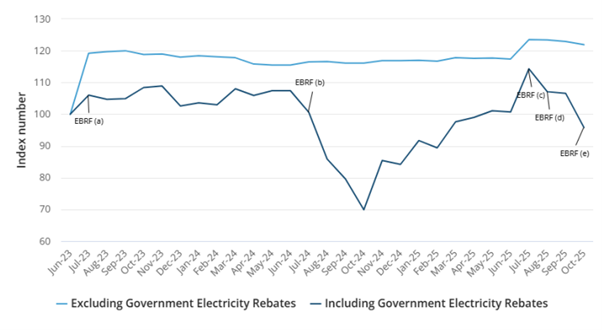
In this chart above, the blue line represents the actual cost of generating electricity in Australia over the period from June 2023 to October 2025. The black line below it is the actual retail cost to Australians after Fed govt subsidies have been provided to reduce the retail price. Since June 2023, the Fed govt has provided five Energy Bill Relief Fund (EBRF) rebates. These are provided by the Commonwealth to individual States to subsidise and reduce the retail price in their own State.
The black line represents the series which is used for electricity in the Australian consumer price index (CPI). Our observation is that rises and falls in this measure also affect the broader CPI after a lag of two quarters. This is important because we can see that between June 2024 and October 2024, this measure of electricity prices fell from 107.4 in June to 69.9 in October 2024.
Our belief was this decline in subsidised electricity prices which allowed the decline in the CPI in Australia in the first half of 2025. This in turn generated an environment for the RBA to cut rates.
How are electricity prices influencing inflation?
After reaching its low of 69.5 in 2024, the retail index rose gradually as the subsidies from the Fed govt declined. This led this component of the CPI to rise to 114.3 in June 2025. This was a rise of 44.8%. It is this rise which months later is feeding its way into the Australian CPI and causing a sharp move up in the CPI as we move towards the end of calendar 2025.
By the time of the October CPI, this had led that index to rise at a rate of 3.8% from the level the year before. What happens in the future to this component of the CPI is entirely dependent upon govt policy. A previous statement by the Treasurer is that no more subsidies will be provided by the end of this year. We will have to wait and see what emerges in the budget for 2026.
What is driving the cost of electricity generation?
Our major concern is not with the series including government rebates. Our major concern is with the cost of generating electricity, excluding the electricity rebates. We now turn our attention to the light blue line. This shows that the cost of generating electricity rose from an index level of 100 in June 2023 to 121.9 in October 2025. This is a rise of 21.9% in two years.
In this period the Australian economy is undertaking an energy transition to renewable generating system. This means that an increasing amount of electricity is being generated by solar panels and wind mills. Our understanding is that at the time of writing, this renewable component of electricity has now risen to 36% of total electricity output. We are told that these forms of renewable energy are the cheapest form of generation. Why therefore has the price made such a significant rise?
It is true that solar panels and windmills will generate very cheap energy for periods of time during the day. The problem however is opposed to the variable generation of energy for parts of the day, consumers demand that electricity be available 100% of the day.
How does gas pricing affect renewable energy costs?
This ability is provided by forms of energy which stabilise or “firm” generation so that power will be available 100% of the day. At this time, the only form of energy which can currently provide this stability at scale comes from gas peaking plants. This means that natural gas is the form of energy which provides the last marginal unit of production which makes electricity available. Economists know that for a market to clear and a product to be available 100% of the day, then the price of the good must be equal to the last margin unit of production. In this case that last margin of production is provided by natural gas. So the pricing of renewal energy is governed by the pricing of natural gas.
What are the implications for interest rates and the Australian dollar?
This means that renewable energy will be very cheap if that natural gas is available at a cheap price. This for example was the case in Germany before the war in the Ukraine. Up until that time, the last unit of renewable energy was being provided by very cheap natural gas.
What then happened was that that very cheap Russian natural gas was replaced by more expensive Norwegian gas and even more expensive gas provided by American LNG.
In the long term, it is the price of natural gas which is determining the increasing cost of Australian renewable energy. In the short term, anecdotal evidence suggests the rise in electricity price in eastern Australia followed the closure of the Liddell Power Station near Muswellbrook in 2023. The station had four 500Mw generating units with the last taken off line in April 2023. At the time of closure, Liddle was supplying 10% of NSW electricity demand. This closely tallies with the escalation of electricity generation cost in mid 2023. This suggests that the problem is not whether renewable energy is or is not preferable to coal power electricity.
The issue is that there is not enough electricity currently being generated. It is this shortage of electricity which has generated an increase in price. We note that the electricity price in the chart above Excluding Government Electricity Rebates, increases in price immediately after the time when Liddell power station is withdrawn from service.
The result of this inflation influence from electricity prices is that the Australian cash rate will rise during calendar 2025. Our model of the cash rate currently suggests two rate hikes each of 25 basis points in the first half of 2026. This will take the Australian cash rate to 4.1%.
At the same time that the Australian cash rate is rising, the US Fed Funds rate should be falling. Our model of the Fed Funds rate currently suggests an equilibrium level of 3.32%. This suggests two rate cuts, the first in December 2025 and the second in the first quarter of 2026.
The fact that the Fed Funds rate should fall at the same time as the Australian cash rate should rise, immediately suggests a rise in the Australian dollar. We expect the $A/$US exchange rate to rise to US71cents by the middle of 2026.
What does this mean for commodities and equity markets?
The falling Fed Funds rate should of course put downward pressure on the US dollar. This will in turn allow a revival of commodity prices. We expect a broad based recovery in commodity prices, beginning with soft commodity prices. The fall in the $US should generate a significant recovery in the price of wheat, corn and cotton. Following the recovery in soft commodities, we should see the beginning of recovery in oil and gas. This recovery in oil and gas is in spite of the very pessimistic outlook that is currently gripping the energy market. This broad recovery in commodities should generate a healthy recovery in Australian cyclical stocks.
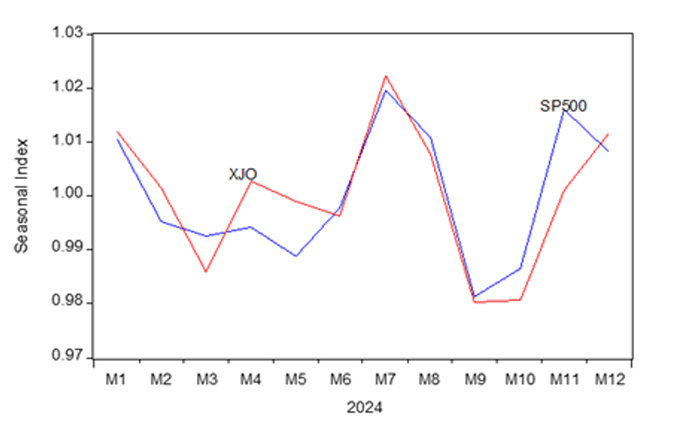
Our model for the S&P500 and the ASX200 both show that both these markets are overbought. This means that they are both significantly higher than the fair value presented by our model. This level of over-valuation is not unusual at this time of the year. Our chart above shows average seasonal variation in both the S&P500 and the ASX200. Both rally to near term peaks in November and December. These seasonal peaks are then followed by a correction continuing up until March/April.
What is the near term market outlook?
We think this kind of seasonal correction is likely to follow in coming months. The correction should be mostly completed by the end of March 2026. The correction is on a seasonal basis because at the end of the European financial year in March, investment institutions tend to withdraw from the market ahead of their end of financial year balanced dates.
In summary, our view is that both the Australian economy and the US economy, still share an outlook for healthy growth. A fall in the $US as we go into the early months of calendar 2026, should have the result of a broad recovery in commodity prices. This should generate an earnings recovery for Australian stocks.
In the very short term, we think both the US and Australian markets are overbought. Still, if we are patient, by the time we get to the end of the first quarter, a strong outlook of market recovery should then arise.
Learn more about our Financial Planning, Stockbroking, Wealth Management and Corporate Advisory and Capital Raising Service
FAQs
What is the Australian GDP forecast for 2026?
We expect GDP growth of around 2.1% in 2025, improving to about 2.3% in 2026 as global conditions and domestic demand firm.
Why is inflation rising in Australia in 2025?
Retail electricity prices rebounded as subsidies eased and generation costs climbed, feeding into CPI with a lag. Tight supply conditions have amplified the effect.
How will interest rates change into 2026?
Our base case is two RBA hikes (2 × 25 bps) in the first half of 2026, while the Fed trims its policy rate. The divergence favours a stronger AUD.
What role does renewable energy play in electricity prices?
Renewables lower average costs when firming is efficient and gas is cheap. When firming costs rise or gas supply tightens, wholesale prices increase.
Is the Australian economy outlook 2026 positive for markets?
After a seasonal correction into March/April 2026, a softer USD and recovering commodities should support Australian cyclicals and broader market performance.